Regression - How to program the Best Fit Line
Welcome to the 9th part of our machine learning regression tutorial within our Machine Learning with Python tutorial series. We've been working on calculating the regression, or best-fit, line for a given dataset in Python. Previously, we wrote a function that will gather the slope, and now we need to calculate the y-intercept. Our code up to this point:
from statistics import mean
import numpy as np
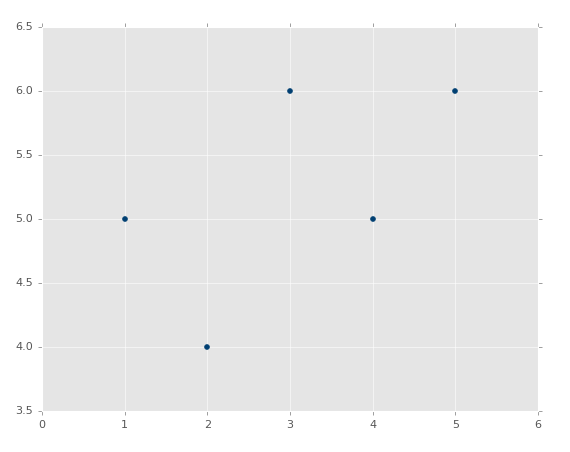
xs = np.array([1,2,3,4,5], dtype=np.float64)
ys = np.array([5,4,6,5,6], dtype=np.float64)
def best_fit_slope(xs,ys):
m = (((mean(xs)*mean(ys)) - mean(xs*ys)) /
((mean(xs)*mean(xs)) - mean(xs*xs)))
return m
m = best_fit_slope(xs,ys)
print(m)
As a reminder, the calculation for the best-fit line's y-intercept is:
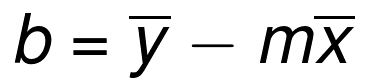
This one will be a bit easier than the slope was. We can save a few lines by incorporating this into our other function. We'll rename it to best_fit_slope_and_intercept.
Next, we can fill in: b = mean(ys) - (m*mean(xs)), and return m and b:
def best_fit_slope_and_intercept(xs,ys):
    m = (((mean(xs)*mean(ys)) - mean(xs*ys)) /
         ((mean(xs)*mean(xs)) - mean(xs*xs)))

    b = mean(ys) - m*mean(xs)

    return m, b
Now we can call upon it with: m, b = best_fit_slope_and_intercept(xs,ys)
Our full code up to this point:
from statistics import mean
import numpy as np

xs = np.array([1,2,3,4,5], dtype=np.float64)
ys = np.array([5,4,6,5,6], dtype=np.float64)

def best_fit_slope_and_intercept(xs,ys):
    m = (((mean(xs)*mean(ys)) - mean(xs*ys)) /
         ((mean(xs)*mean(xs)) - mean(xs*xs)))

    b = mean(ys) - m*mean(xs)

    return m, b

m, b = best_fit_slope_and_intercept(xs,ys)

print(m,b)
Output should be: 0.3 4.3
Now we just need to create a line for the data:
Recall that y=mx+b. We could make a function for this... or just knock it out in a single 1-liner for loop:
regression_line = [(m*x)+b for x in xs]
The above 1-liner for loop is the same as doing:
regression_line = []
for x in xs:
    regression_line.append((m*x)+b)
Great, let's reap the fruits of our labor finally! Add the following imports:
import matplotlib.pyplot as plt
from matplotlib import style
style.use('ggplot')
This will allow us to make graphs, and make them not so ugly. Now at the end:
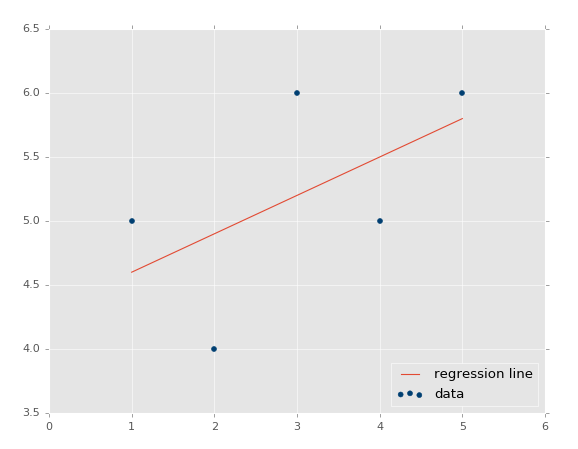
plt.scatter(xs,ys,color='#003F72')
plt.plot(xs, regression_line)
plt.show()
First we plot a scatter plot of the existing data, then we graph our regression line, then finally show it. If you're not familiar with , you can check out the Data Visualization with Python and Matplotlib tutorial series.
Output:
Congratulations for making it this far! So, how might you go about actually making a prediction based on this model you just made? Simple enough, right? You have your model, you just fill in x. For example, let's predict out a couple of points:
predict_x = 7
We have our input data, our "feature" so to speak. What's the label?
predict_y = (m*predict_x)+b
print(predict_y)
Output: 6.4
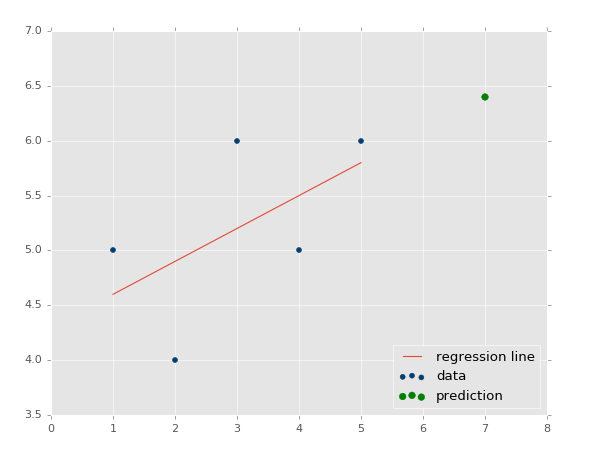
We can even graph it:
predict_x = 7
predict_y = (m*predict_x)+b

plt.scatter(xs,ys,color='#003F72',label='data')
plt.plot(xs, regression_line, label='regression line')
plt.legend(loc=4)
plt.show()
Output:
We now know how to create our own models, which is great, but we're stilling missing something integral: how accurate is our model? This is the topic for discussion in the next tutorial!
-
Practical Machine Learning Tutorial with Python Introduction
-
Regression - Intro and Data
-
Regression - Features and Labels
-
Regression - Training and Testing
-
Regression - Forecasting and Predicting
-
Pickling and Scaling
-
Regression - Theory and how it works
-
Regression - How to program the Best Fit Slope
-
Regression - How to program the Best Fit Line
-
Regression - R Squared and Coefficient of Determination Theory
-
Regression - How to Program R Squared
-
Creating Sample Data for Testing
-
Classification Intro with K Nearest Neighbors
-
Applying K Nearest Neighbors to Data
-
Euclidean Distance theory
-
Creating a K Nearest Neighbors Classifer from scratch
-
Creating a K Nearest Neighbors Classifer from scratch part 2
-
Testing our K Nearest Neighbors classifier
-
Final thoughts on K Nearest Neighbors
-
Support Vector Machine introduction
-
Vector Basics
-
Support Vector Assertions
-
Support Vector Machine Fundamentals
-
Constraint Optimization with Support Vector Machine
-
Beginning SVM from Scratch in Python
-
Support Vector Machine Optimization in Python
-
Support Vector Machine Optimization in Python part 2
-
Visualization and Predicting with our Custom SVM
-
Kernels Introduction
-
Why Kernels
-
Soft Margin Support Vector Machine
-
Kernels, Soft Margin SVM, and Quadratic Programming with Python and CVXOPT
-
Support Vector Machine Parameters
-
Machine Learning - Clustering Introduction
-
Handling Non-Numerical Data for Machine Learning
-
K-Means with Titanic Dataset
-
K-Means from Scratch in Python
-
Finishing K-Means from Scratch in Python
-
Hierarchical Clustering with Mean Shift Introduction
-
Mean Shift applied to Titanic Dataset
-
Mean Shift algorithm from scratch in Python
-
Dynamically Weighted Bandwidth for Mean Shift
-
Introduction to Neural Networks
-
Installing TensorFlow for Deep Learning - OPTIONAL
-
Introduction to Deep Learning with TensorFlow
-
Deep Learning with TensorFlow - Creating the Neural Network Model
-
Deep Learning with TensorFlow - How the Network will run
-
Deep Learning with our own Data
-
Simple Preprocessing Language Data for Deep Learning
-
Training and Testing on our Data for Deep Learning
-
10K samples compared to 1.6 million samples with Deep Learning
-
How to use CUDA and the GPU Version of Tensorflow for Deep Learning
-
Recurrent Neural Network (RNN) basics and the Long Short Term Memory (LSTM) cell
-
RNN w/ LSTM cell example in TensorFlow and Python
-
Convolutional Neural Network (CNN) basics
-
Convolutional Neural Network CNN with TensorFlow tutorial
-
TFLearn - High Level Abstraction Layer for TensorFlow Tutorial
-
Using a 3D Convolutional Neural Network on medical imaging data (CT Scans) for Kaggle
-
Classifying Cats vs Dogs with a Convolutional Neural Network on Kaggle
-
Using a neural network to solve OpenAI's CartPole balancing environment
