Hierarchical Clustering with Mean Shift Introduction
Welcome to the 39th part of our machine learning tutorial series, and another tutorial within the topic of Clustering.. We continue the topic of clustering and unsupervised machine learning with the introduction of the Mean Shift algorithm.
Mean Shift is very similar to the K-Means algorithm, except for one very important factor: you do not need to specify the number of groups prior to training. The Mean Shift algorithm finds clusters on its own. For this reason, it is even more of an "unsupervised" machine learning algorithm than K-Means.
The way Mean Shift works is to go through each featureset (a datapoint on a graph), and proceed to do a hill climb operation. Hill Climbing is just as it sounds: The idea is to continually increase, or go up, until you cannot anymore. We don't have for sure just one local maximal value. We might have only one, or we might have ten. Our "hill" in this case will be the number of featuresets/datapoints within a given radius. The radius is also called a bandwidth, and the entire window is your Kernel. The more data within the window, the better. Once we can no longer take another step without decreasing the number of featuresets/datapoints within the radius, we take the mean of all data in that region and we have located a cluster center. We do this starting from each data point. Many data points will lead to the same cluster center, which should be expected, but it is also possible that other data points will take you to a completely separate cluster center.
Immediately, however, you should begin to recognize the major downside for this operation: Scale. Scale sure seems to be a consistent problem. So we're running this optimization algorithm starting from every...single...datapoint. That's rough. There are some methods we can use to speed this up, but, regardless, this algorithm can still be quite costly.
While this method is a hierarchical clustering method, your kernel can be flat or something like a Gaussian kernel. Recall the kernel is your "window." When finding the mean, we can either have every featureset with the same weight (flat kernel), or assign weights by proximity to the kernel's center (Gaussian Kernel).
What is Mean Shift used for? Along with the clustering uses mentioned before, Mean Shift is also very popular in image analysis for both tracking and smoothing. For now, we're going to focus purely on the featureset clustering aspects.
By now, we've covered the basics of using Scikit-Learn and visualization with Matplotlib, along with attributes of classifiers, so I will just plop the code down here:
import numpy as np
from sklearn.cluster import MeanShift
from sklearn.datasets.samples_generator import make_blobs
import matplotlib.pyplot as plt
from mpl_toolkits.mplot3d import Axes3D
from matplotlib import style
style.use("ggplot")
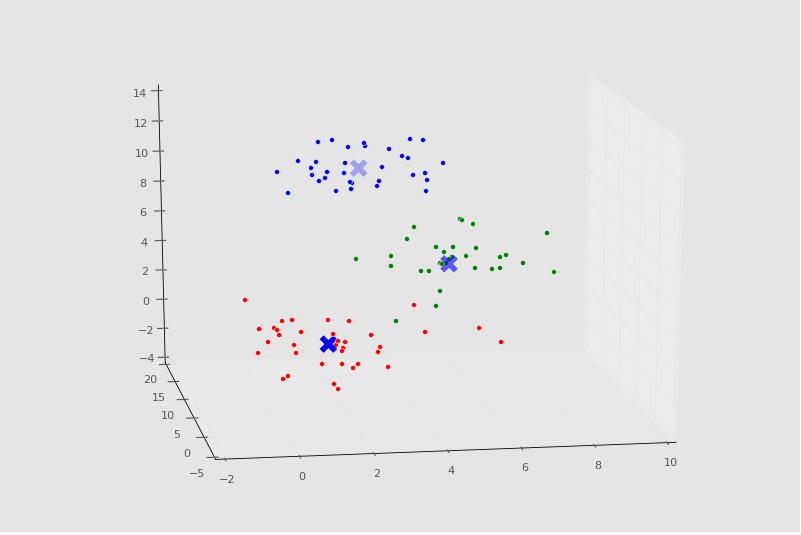
centers = [[1,1,1],[5,5,5],[3,10,10]]
X, _ = make_blobs(n_samples = 100, centers = centers, cluster_std = 1.5)
ms = MeanShift()
ms.fit(X)
labels = ms.labels_
cluster_centers = ms.cluster_centers_
print(cluster_centers)
n_clusters_ = len(np.unique(labels))
print("Number of estimated clusters:", n_clusters_)
colors = 10*['r','g','b','c','k','y','m']
fig = plt.figure()
ax = fig.add_subplot(111, projection='3d')
for i in range(len(X)):
ax.scatter(X[i][0], X[i][1], X[i][2], c=colors[labels[i]], marker='o')
ax.scatter(cluster_centers[:,0],cluster_centers[:,1],cluster_centers[:,2],
marker="x",color='k', s=150, linewidths = 5, zorder=10)
plt.show()
Console Output:
[[  1.26113946   1.24675516   1.04657994]
 [  4.87468691   4.88157787   5.15456168]
 [  2.77026724  10.3096062   10.40855045]]
Number of estimated clusters: 3
Chart:
-
Practical Machine Learning Tutorial with Python Introduction
-
Regression - Intro and Data
-
Regression - Features and Labels
-
Regression - Training and Testing
-
Regression - Forecasting and Predicting
-
Pickling and Scaling
-
Regression - Theory and how it works
-
Regression - How to program the Best Fit Slope
-
Regression - How to program the Best Fit Line
-
Regression - R Squared and Coefficient of Determination Theory
-
Regression - How to Program R Squared
-
Creating Sample Data for Testing
-
Classification Intro with K Nearest Neighbors
-
Applying K Nearest Neighbors to Data
-
Euclidean Distance theory
-
Creating a K Nearest Neighbors Classifer from scratch
-
Creating a K Nearest Neighbors Classifer from scratch part 2
-
Testing our K Nearest Neighbors classifier
-
Final thoughts on K Nearest Neighbors
-
Support Vector Machine introduction
-
Vector Basics
-
Support Vector Assertions
-
Support Vector Machine Fundamentals
-
Constraint Optimization with Support Vector Machine
-
Beginning SVM from Scratch in Python
-
Support Vector Machine Optimization in Python
-
Support Vector Machine Optimization in Python part 2
-
Visualization and Predicting with our Custom SVM
-
Kernels Introduction
-
Why Kernels
-
Soft Margin Support Vector Machine
-
Kernels, Soft Margin SVM, and Quadratic Programming with Python and CVXOPT
-
Support Vector Machine Parameters
-
Machine Learning - Clustering Introduction
-
Handling Non-Numerical Data for Machine Learning
-
K-Means with Titanic Dataset
-
K-Means from Scratch in Python
-
Finishing K-Means from Scratch in Python
-
Hierarchical Clustering with Mean Shift Introduction
-
Mean Shift applied to Titanic Dataset
-
Mean Shift algorithm from scratch in Python
-
Dynamically Weighted Bandwidth for Mean Shift
-
Introduction to Neural Networks
-
Installing TensorFlow for Deep Learning - OPTIONAL
-
Introduction to Deep Learning with TensorFlow
-
Deep Learning with TensorFlow - Creating the Neural Network Model
-
Deep Learning with TensorFlow - How the Network will run
-
Deep Learning with our own Data
-
Simple Preprocessing Language Data for Deep Learning
-
Training and Testing on our Data for Deep Learning
-
10K samples compared to 1.6 million samples with Deep Learning
-
How to use CUDA and the GPU Version of Tensorflow for Deep Learning
-
Recurrent Neural Network (RNN) basics and the Long Short Term Memory (LSTM) cell
-
RNN w/ LSTM cell example in TensorFlow and Python
-
Convolutional Neural Network (CNN) basics
-
Convolutional Neural Network CNN with TensorFlow tutorial
-
TFLearn - High Level Abstraction Layer for TensorFlow Tutorial
-
Using a 3D Convolutional Neural Network on medical imaging data (CT Scans) for Kaggle
-
Classifying Cats vs Dogs with a Convolutional Neural Network on Kaggle
-
Using a neural network to solve OpenAI's CartPole balancing environment
