Introduction to Matplotlib and basic line
Welcome to a Matplotlib with Python 3+ tutorial series. In this series, we're going to be covering most aspects to the Matplotlib data visualization module. Matplotlib is capable of creating most kinds of charts, like line graphs, scatter plots, bar charts, pie charts, stack plots, 3D graphs, and geographic map graphs.
First, in order to actually use Matplotlib, we're going to need it!
If you have a later version of Python installed, you should be able to open cmd.exe/terminal and then run:
pip install matplotlib
Note: You may need to do C:/Python34/Scripts/pip install matplotlib if the above shorter version doesn't work.
If, when importing matplotlib, you get an error something like "no module named" and a module name, it means you need to also install that module. A common issue is that people do not have the module named "six." This means you need to pip install six.
Alternatively, you can head to Matplotlib.org and install by heading to the downloads section and downloading your appropriate version. Keep in mind that, just because you have a 64 bit operating system, you do not necessarily have a 64 bit version of Python. Chances are, you have 32 bit unless you tried to get 64 bit. Open IDLE and read the top. If it says you have 64 bit, you have 64 bit, if it says 32, then you have 32 bit. Once you have Python installed, you're ready to rumble. You can code this logic however you wish. I prefer to code using IDLE, but feel free to use whatever you prefer.
import matplotlib.pyplot as plt
This line imports the integral pyplot, which we're going to use throughout this entire series. We import pyplot as plt, and this is a traditional standard for python programs using pylot.
plt.plot([1,2,3],[5,7,4])
Next, we invoke the .plot method of pyplot to plot some coordinates. This .plot takes many parameters, but the first two here are 'x' and 'y' coordinates, which we've placed lists into. This means, we have 3 coordinates according to these lists: 1,5 2,7 and 3,4.
The plt.plot will "draw" this plot in the background, but we need to bring it to the screen when we're ready, after graphing everything we intend to.
plt.show()
With that, the graph should pop up. If not, sometimes it can pop under, or you may have gotten an error. Your graph should look like:

This window is a matplotlib window, which allows us to see our graph, as well as interact with it and navigate it. You can hover the graph and see the coordinates in the bottom right typically. You can also utilize the buttons. These may be in various locations, but, in the picture above, these are the buttons that are in the lower left corner.
Home Button

The home button will help you once you have begun navigating your chart. If you ever want to return back to the original view, you can click on this. Clicking this before you have navigated your graph will do nothing.
Forward/Back buttons

These buttons can be used like the forward and back buttons in your browser. You can click these to move back to the previous point you were at, or forward again.
Pan Axis

This cross-looking button allows you to click it, and then click and drag your graph around.
Zoom

The zoom button lets you click on it, then click and drag a square that you would like to zoom into specifically. Zooming in will require a left click and drag. You can alternatively zoom out with a right click and drag.
Configure Subplots

This button allows you to configure various spacing options with your figure and plot. Clicking it will bring up:
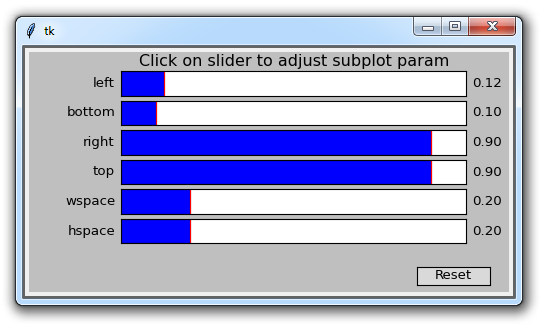
Each of those blue bars is a slider, which allows you to adjust the padding. Some of these wont do anything right now, because there aren't any other subplots. Left, bottom, right, and top adjust the padding of the figure from the edge of the window. Then wspace and hspace correspond to when you have multiple subplots, and this will act like "spacing" or "padding" between them.
Save Figure

This button will allow you to save your figure in various forms.
So there's a quick introduction to matplotlib, we have much more to cover!
There exists 2 quiz/question(s) for this tutorial. for access to these, video downloads, and no ads.
-
Introduction to Matplotlib and basic line
-
Legends, Titles, and Labels with Matplotlib
-
Bar Charts and Histograms with Matplotlib
-
Scatter Plots with Matplotlib
-
Stack Plots with Matplotlib
-
Pie Charts with Matplotlib
-
Loading Data from Files for Matplotlib
-
Data from the Internet for Matplotlib
-
Converting date stamps for Matplotlib
-
Basic customization with Matplotlib
-
Unix Time with Matplotlib
-
Colors and Fills with Matplotlib
-
Spines and Horizontal Lines with Matplotlib
-
Candlestick OHLC graphs with Matplotlib
-
Styles with Matplotlib
-
Live Graphs with Matplotlib
-
Annotations and Text with Matplotlib
-
Annotating Last Price Stock Chart with Matplotlib
-
Subplots with Matplotlib
-
Implementing Subplots to our Chart with Matplotlib
-
More indicator data with Matplotlib
-
Custom fills, pruning, and cleaning with Matplotlib
-
Share X Axis, sharex, with Matplotlib
-
Multi Y Axis with twinx Matplotlib
-
Custom Legends with Matplotlib
-
Basemap Geographic Plotting with Matplotlib
-
Basemap Customization with Matplotlib
-
Plotting Coordinates in Basemap with Matplotlib
-
3D graphs with Matplotlib
-
3D Scatter Plot with Matplotlib
-
3D Bar Chart with Matplotlib
-
Conclusion with Matplotlib
