Machine Learning - Clustering Introduction
Welcome to the 34th part of our machine learning tutorial series and the start of a new section: Clustering and Unsupervised machine learning. Up to this point, everything we have covered has been "supervised" machine learning, which means, we, the scientist, have told the machine what the classes of featuresets were. With unsupervised machine learning, the role of the scientist begins to be removed. To begin, we're going to cover clustering, which comes in two major forms: Flat and Hierarchical.
With both forms of clustering, the machine is tasked with receiving a dataset that is just featuresets, and then the machine searches for groups and assigns classes on its own. With Flat clustering, the scientist tells the machine how many classes/clusters to find. With Hierarchical clustering, the machine figures out the groups and how many.
What are some reasons why we might utilize clustering? The objective of clustering is to find relationships and meaning in data. In most cases that I have personally seen, people use clustering mostly as a step in what's known as "semi-supervised" machine learning. The idea here is you might use clustering to define classes, and then use a supervised machine learning algorithm to do further classification. Another use is for feature selection and validation. For example, consider our Breast Cancer dataset that we've been using. We might believe the features we've chosen are indeed descriptive and meaningful. One option we have is to feed this data through a K Means algorithm, and then indeed see whether or not the two groups we thought we were tracking were actually described by the data in a way we expected.
Consider next that you're a data scientist for Amazon. Your CTO has data collected that they believe could be used to predict whether or not customers are buyers or non-buyers. They want you to use K-Means to see if K-Means correctly organizes the customers by the data that the CTO thinks is meaningful.
What about Hierarchical Clustering? Consider you're still the same data scientist for Amazon. This time, you run the seemingly meaningful data through a hierarchical clustering algorithm, such as Mean Shift, and you actually get 5 groups. After further analysis, you realize visitors aren't actually just buyers and non-buyers, they are a spectrum! You really have non-buyers, unlikely-to-buyers, slightly-to-buyers, highly-likely-to-buyers, and certain-to-buyers.
Clustering can also be used on truly unknown data, in attempt to find structure. Consider you're an alien race first discovering human texts in North America. You might take all of the written characters you find and compile them into a big list of features. Then you might feed this list through a Hierarchical Clustering algorithm just to see if you can find specific groups so that you can start to decode the language by characters.
The field of "Big Data Analysis" is generally a prime area for clustering. There's plenty of data, but most companies have absolutely no idea what to do with it or how to actually get meaning from it. Clustering can help data scientists to begin to structure and look into expansive datasets for meaning.
Finally, clustering can also be used for typical classification, you just don't actually need to feed it what the classifications are beforehand, but, if you use clustering on most of the popular classification datasets, you should find that it tends to figure out the groups anyway. This is mainly useful for "testing" the algorithm to make sure it actually works.
Our first algorithm to cover is the K-Means algorithm. The idea of K-Means is to attempt to cluster a given dataset into K clusters. The way it works is actually pretty impressive, and, luckily for us, quite simple. The process goes as follows:
- Take entire dataset, and set, randomly,
Knumber ofcentroids. Centroids are just the "centers" of your clusters. To start, I typically just take the firstKvalues in my dataset and have those as the start, but you could also randomly select them if you wanted. It should not matter, but, if you are not optimizing for some reason, it may make sense to try to shuffle the data and try again. - Calculate distance of each featureset to the centroids, and classify each featureset as the centroid class closest to it. Centroid classes are arbitrary, you will likely just call the first centroid 0, the second centroid 1...and so on.
- Once you have classified all data, now you take the "mean" of the groups, and set the new centroids as the mean of their associated groups.
- Repeat #2 and #3 until you are optimized. Typically, you measure optimization by movement of the centroid. There are many ways to do this, we're just going to use percent change.
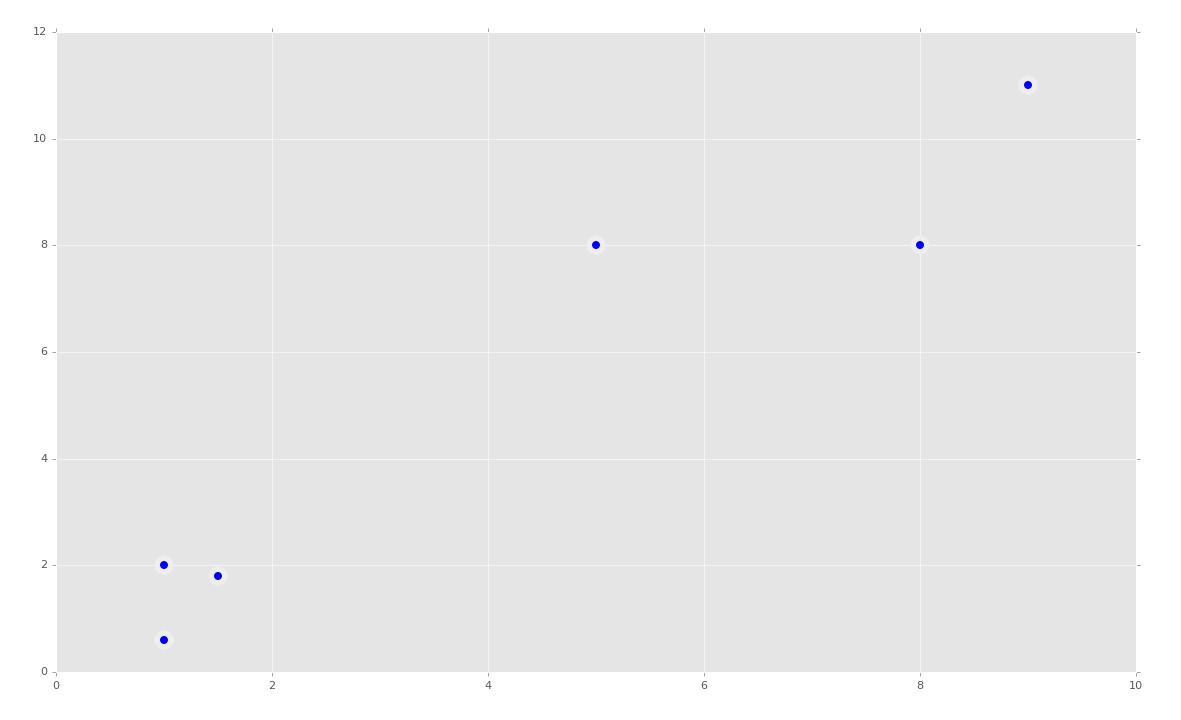
Simple enough, much easier than the Support Vector Machine to understand! Let's see a quick basic code example. To start, we'll have some data like:
import matplotlib.pyplot as plt
from matplotlib import style
import numpy as np
from sklearn.cluster import KMeans
style.use('ggplot')

#ORIGINAL:

X = np.array([[1, 2],
              [1.5, 1.8],
              [5, 8],
              [8, 8],
              [1, 0.6],
              [9, 11]])


plt.scatter(X[:, 0],X[:, 1], s=150, linewidths = 5, zorder = 10)
plt.show()
Our data looks like:
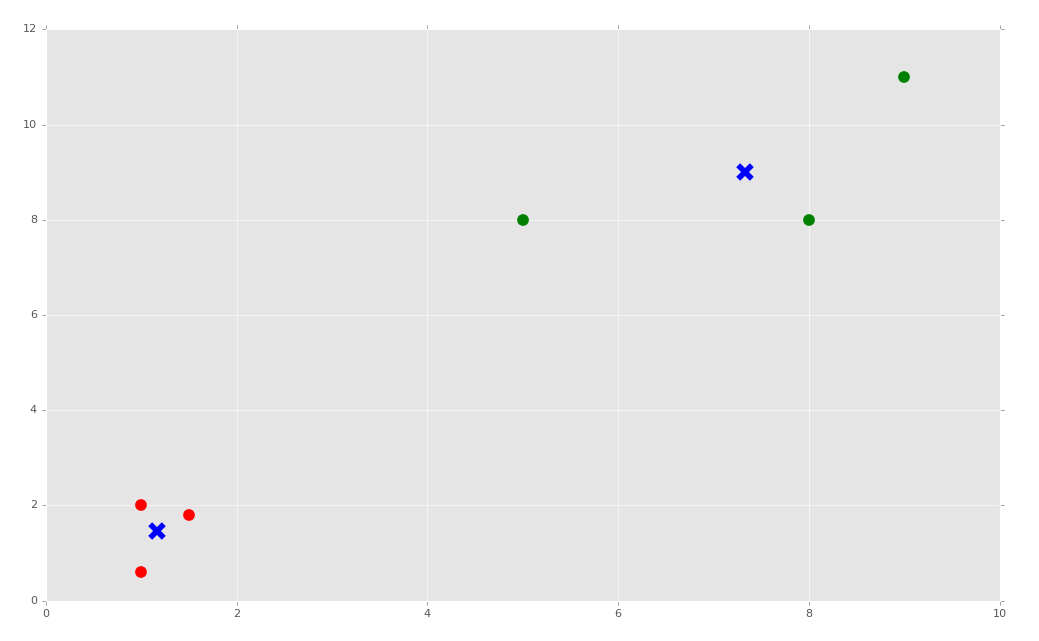
Awesome, this looks pretty simple, so our K-Means algorithm better figure this one out! First we will fit everything:
clf = KMeans(n_clusters=2)
clf.fit(X)
Simple as that, but we'd probably like to see it. As we saw before with the Support Vector Machine, most of the Scikit-Learn classifiers also have various attributes. With the K-Means algorithm, we can grab both the centroids and labels:
centroids = clf.cluster_centers_
labels = clf.labels_
Now to graph, we can do something like:
colors = ["g.","r.","c.","y."]
for i in range(len(X)):
    plt.plot(X[i][0], X[i][1], colors[labels[i]], markersize = 10)
plt.scatter(centroids[:, 0],centroids[:, 1], marker = "x", s=150, linewidths = 5, zorder = 10)
plt.show()
Next, we're going to apply K-Means to an actual dataset, along with cover what happens when you data contains information that is non-numerical.
-
Practical Machine Learning Tutorial with Python Introduction
-
Regression - Intro and Data
-
Regression - Features and Labels
-
Regression - Training and Testing
-
Regression - Forecasting and Predicting
-
Pickling and Scaling
-
Regression - Theory and how it works
-
Regression - How to program the Best Fit Slope
-
Regression - How to program the Best Fit Line
-
Regression - R Squared and Coefficient of Determination Theory
-
Regression - How to Program R Squared
-
Creating Sample Data for Testing
-
Classification Intro with K Nearest Neighbors
-
Applying K Nearest Neighbors to Data
-
Euclidean Distance theory
-
Creating a K Nearest Neighbors Classifer from scratch
-
Creating a K Nearest Neighbors Classifer from scratch part 2
-
Testing our K Nearest Neighbors classifier
-
Final thoughts on K Nearest Neighbors
-
Support Vector Machine introduction
-
Vector Basics
-
Support Vector Assertions
-
Support Vector Machine Fundamentals
-
Constraint Optimization with Support Vector Machine
-
Beginning SVM from Scratch in Python
-
Support Vector Machine Optimization in Python
-
Support Vector Machine Optimization in Python part 2
-
Visualization and Predicting with our Custom SVM
-
Kernels Introduction
-
Why Kernels
-
Soft Margin Support Vector Machine
-
Kernels, Soft Margin SVM, and Quadratic Programming with Python and CVXOPT
-
Support Vector Machine Parameters
-
Machine Learning - Clustering Introduction
-
Handling Non-Numerical Data for Machine Learning
-
K-Means with Titanic Dataset
-
K-Means from Scratch in Python
-
Finishing K-Means from Scratch in Python
-
Hierarchical Clustering with Mean Shift Introduction
-
Mean Shift applied to Titanic Dataset
-
Mean Shift algorithm from scratch in Python
-
Dynamically Weighted Bandwidth for Mean Shift
-
Introduction to Neural Networks
-
Installing TensorFlow for Deep Learning - OPTIONAL
-
Introduction to Deep Learning with TensorFlow
-
Deep Learning with TensorFlow - Creating the Neural Network Model
-
Deep Learning with TensorFlow - How the Network will run
-
Deep Learning with our own Data
-
Simple Preprocessing Language Data for Deep Learning
-
Training and Testing on our Data for Deep Learning
-
10K samples compared to 1.6 million samples with Deep Learning
-
How to use CUDA and the GPU Version of Tensorflow for Deep Learning
-
Recurrent Neural Network (RNN) basics and the Long Short Term Memory (LSTM) cell
-
RNN w/ LSTM cell example in TensorFlow and Python
-
Convolutional Neural Network (CNN) basics
-
Convolutional Neural Network CNN with TensorFlow tutorial
-
TFLearn - High Level Abstraction Layer for TensorFlow Tutorial
-
Using a 3D Convolutional Neural Network on medical imaging data (CT Scans) for Kaggle
-
Classifying Cats vs Dogs with a Convolutional Neural Network on Kaggle
-
Using a neural network to solve OpenAI's CartPole balancing environment
