Classification Intro with K Nearest Neighbors
Welcome to the 13th part of our Machine Learning with Python tutorial series. We begin a new section now: Classification. In covering classification, we're going to cover two major classificiation algorithms: K Nearest Neighbors and the Support Vector Machine (SVM). While these two algorithms are both classification algorithms, they acheive results in different ways.
First, let's consider a dataset that creates the following graph:
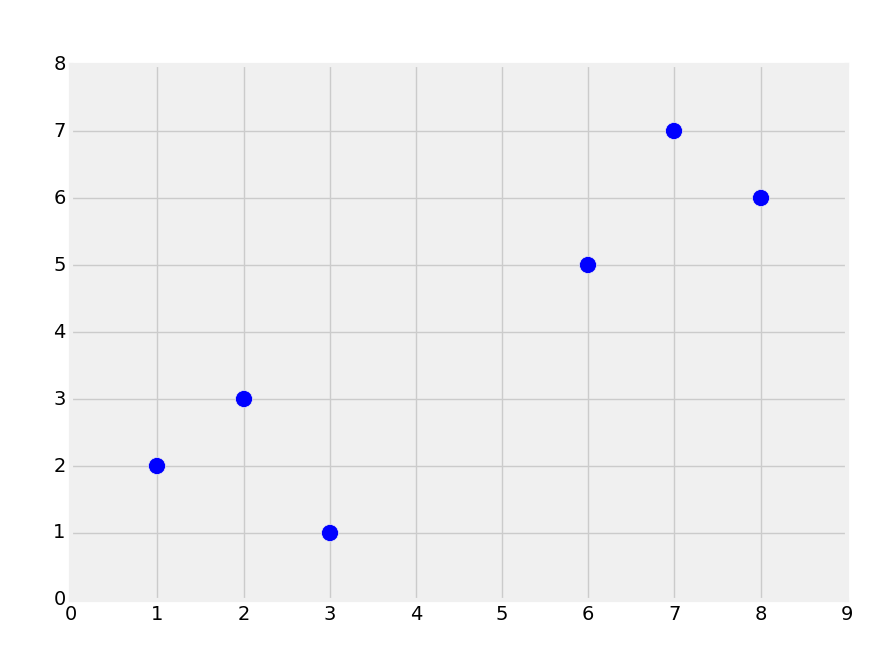
Intuitively, you should be able to look at this, and see two groups. Classification, however, is supervised machine learning. When we feed data into the machine learning algorithm, we're actually already telling it that groups exist, and which data belongs to which group. The similar form of machine learning where you actually have the machine find the groups as well is called clustering, which is an unsupervised machine learning method that we will be covering later in the series. Thus, with supervised learning, we'll actually have prior-labeled data for training, maybe like so:
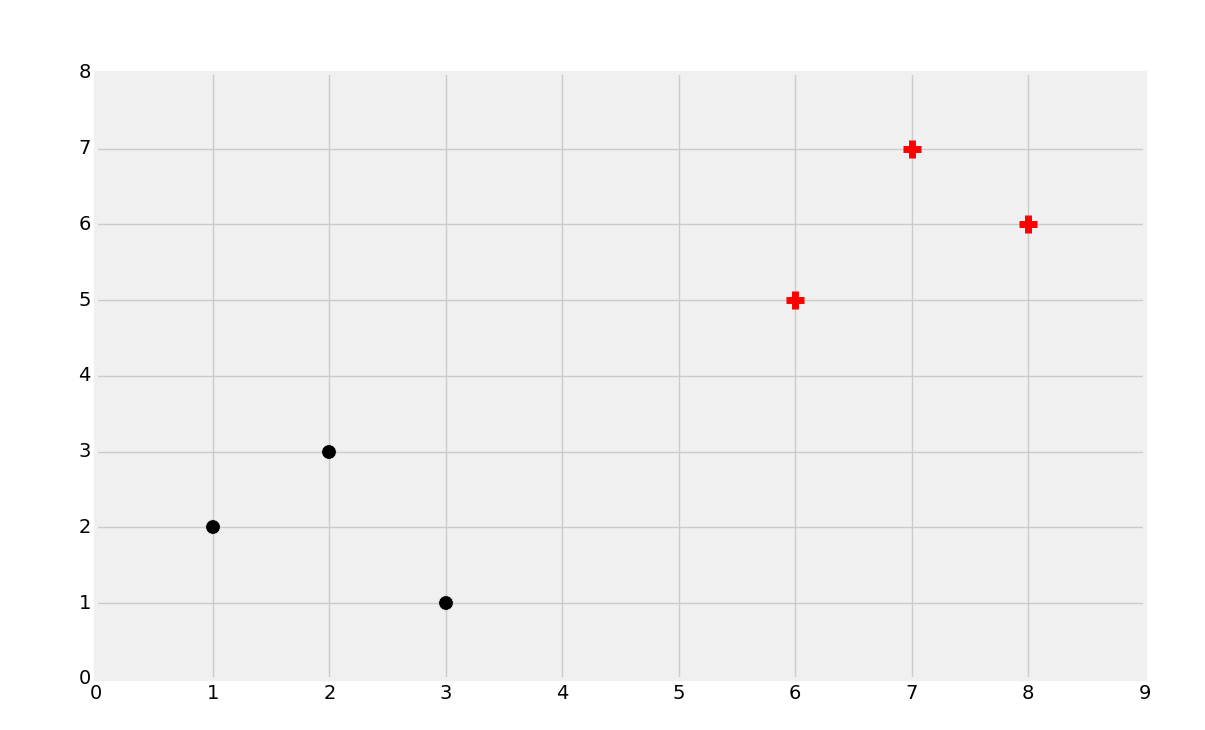
Here, we have the black dots and red plus signs. The purpose of classification is to train a machine on previously known data like we have here, so that the machine can later identify the class (red plus or black dot) of new data. For example, we'll be working with breast tumor data to try to identify malignant and benign breast tumors based on attributes. The way we can do this is to take previously known samples of attributes like size and shape of the tumor as the features, and the label/class is either benign or malignant. From here, we can assess future tumors by their same attributes and predict whether or not the tumor is benign or malignant.
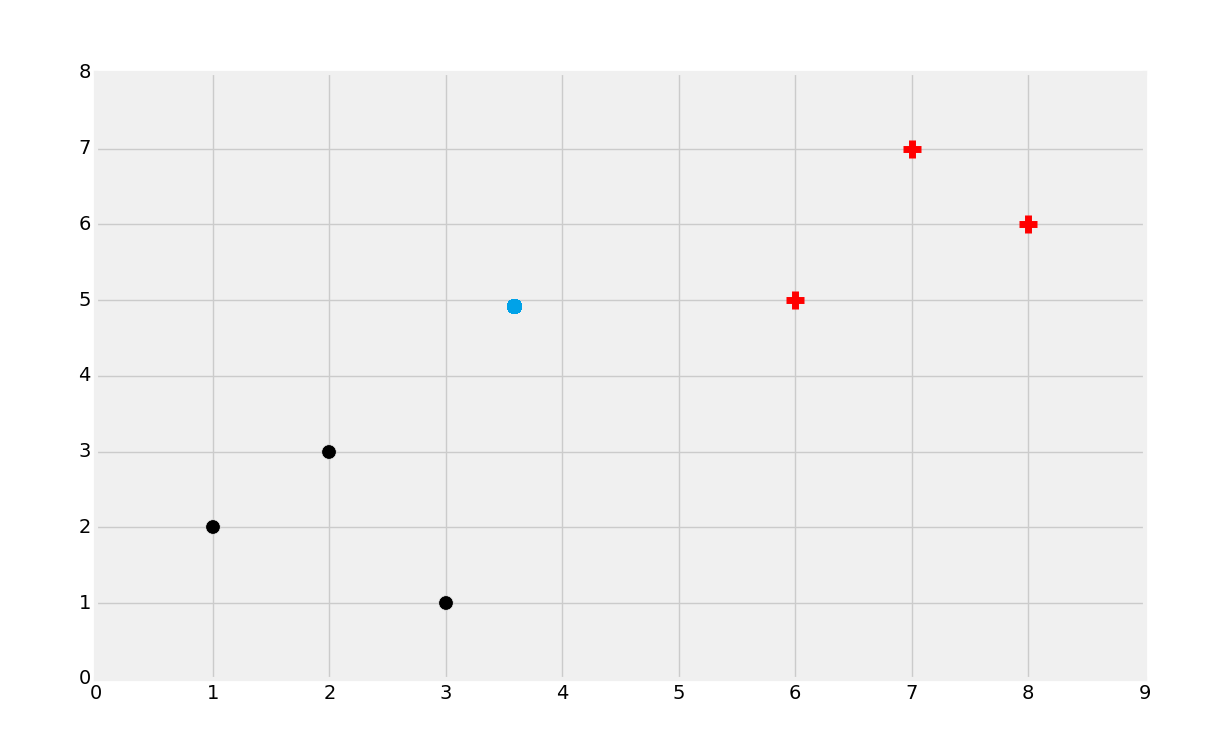
So then, the objective of classification might be to identify which class the following dot belongs to:
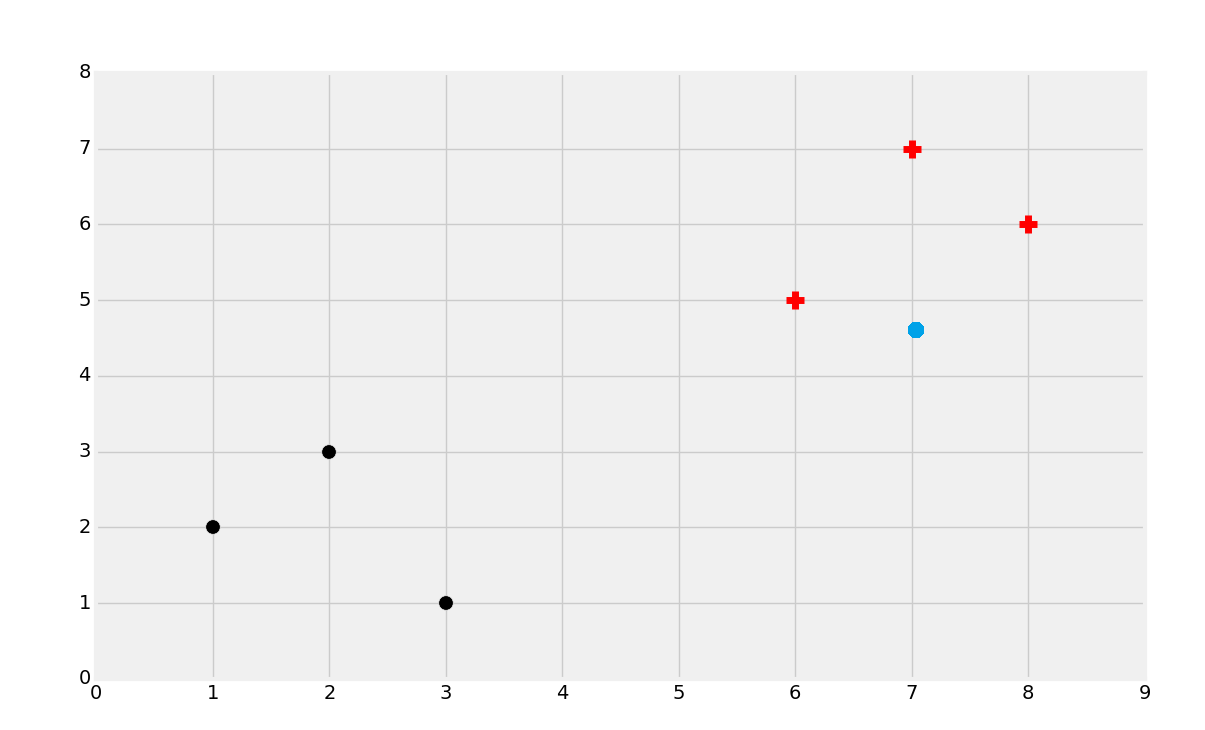
You'd probably guess the red group here. But why? Try to define to yourself what your parameters were. How about in the next case?
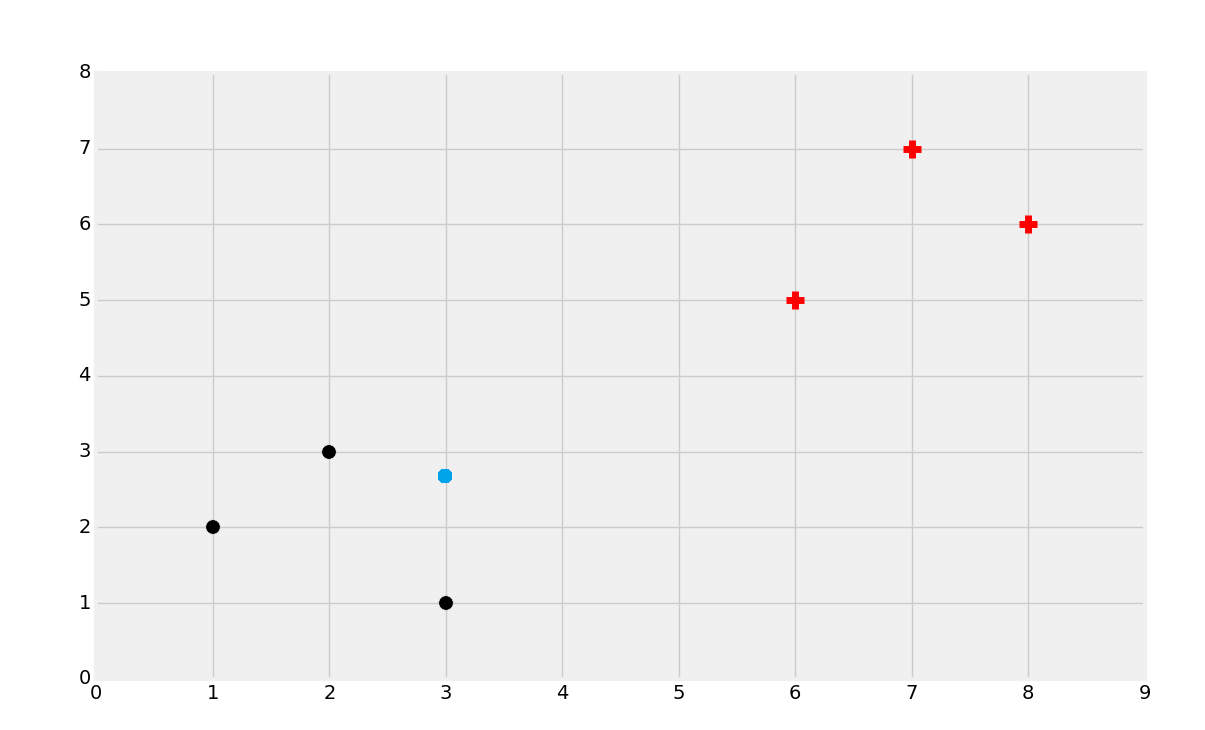
We'd probably pick black in that second case. Again though, try to define why you would choose this. Finally, what about something like:
This last one is a bit harder. Try to actually pick a side.
Most people would choose black in this case. Either way, consider why you've made these choices. Most people are going to group these sorts of datasets by proximity. It just makes the most sense intuitively. If you pulled out a ruler and drew the straight-line distance to the closest black dot, and then to the closest red plus-sign, you'd find the black dot is indeed closer. Similarly, when the dots were closer to one group than the other, you made the judgement most likely based purely on proximity. Thus, a machine learning algorithm is born: K Nearest Neighbors.
K Nearest Neighbors is a simple and effective machine learning classification algorithm overall. If this is so easy, as we just saw, why do we even need an algorithm as opposed to just looking at the data ourselves? Just like we learned with regression, machines can both calculate much faster, working on larger datasets, scale, and, maybe most importantly, work in many dimensions, such as 100.
The way it works is completely in the name. K is a number you can choose, and then neighbors are the data points from known data. We're looking for any number of the "nearest" neighbors. Let's say K = 3, so then we're looking for the two closest neighboring points. For example:
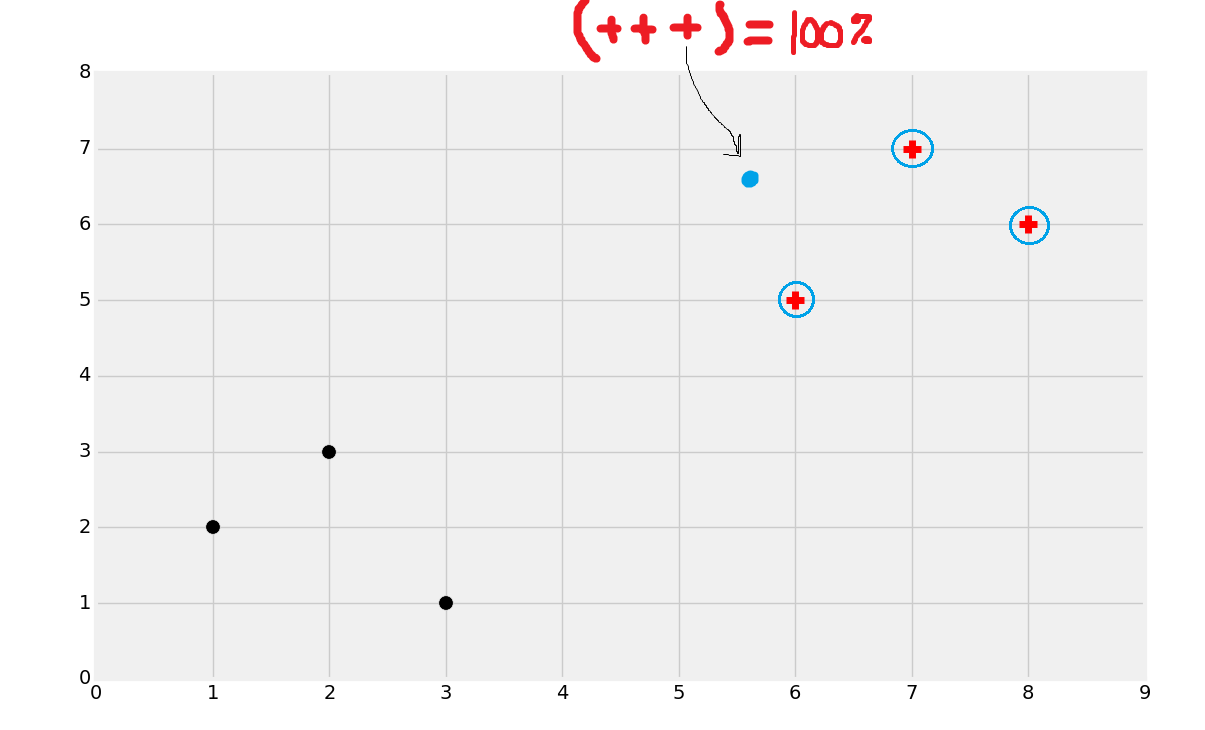
In the above image, I circled the three nearest neighbors. In that case, all three were of the + class. K Nearest Neighbors is going to basically go to a majority vote based on the neighbors. In this case, all three neighbors were +, so this is 100% a + class. If 2 neighbors were red + and 1 was a black dot, we'd still classify this is a +, just with a bit less confidence. Note that, due to the nature of the vote, you will likely want to use an odd number for K, otherwise you may find yourself in a 50/50 split situation. There are ways to apply "weights" to the distance, to penalize more for greater distances, so then you could have an even number for K if you wanted.
In the next tutorial, we're going to incorporate the scikit-learn algorithm for K Nearest Neighbors on breast cancer data, and then we'll try our own hand at creating the algorithm ourselves.
There exists 2 quiz/question(s) for this tutorial. for access to these, video downloads, and no ads.
-
Practical Machine Learning Tutorial with Python Introduction
-
Regression - Intro and Data
-
Regression - Features and Labels
-
Regression - Training and Testing
-
Regression - Forecasting and Predicting
-
Pickling and Scaling
-
Regression - Theory and how it works
-
Regression - How to program the Best Fit Slope
-
Regression - How to program the Best Fit Line
-
Regression - R Squared and Coefficient of Determination Theory
-
Regression - How to Program R Squared
-
Creating Sample Data for Testing
-
Classification Intro with K Nearest Neighbors
-
Applying K Nearest Neighbors to Data
-
Euclidean Distance theory
-
Creating a K Nearest Neighbors Classifer from scratch
-
Creating a K Nearest Neighbors Classifer from scratch part 2
-
Testing our K Nearest Neighbors classifier
-
Final thoughts on K Nearest Neighbors
-
Support Vector Machine introduction
-
Vector Basics
-
Support Vector Assertions
-
Support Vector Machine Fundamentals
-
Constraint Optimization with Support Vector Machine
-
Beginning SVM from Scratch in Python
-
Support Vector Machine Optimization in Python
-
Support Vector Machine Optimization in Python part 2
-
Visualization and Predicting with our Custom SVM
-
Kernels Introduction
-
Why Kernels
-
Soft Margin Support Vector Machine
-
Kernels, Soft Margin SVM, and Quadratic Programming with Python and CVXOPT
-
Support Vector Machine Parameters
-
Machine Learning - Clustering Introduction
-
Handling Non-Numerical Data for Machine Learning
-
K-Means with Titanic Dataset
-
K-Means from Scratch in Python
-
Finishing K-Means from Scratch in Python
-
Hierarchical Clustering with Mean Shift Introduction
-
Mean Shift applied to Titanic Dataset
-
Mean Shift algorithm from scratch in Python
-
Dynamically Weighted Bandwidth for Mean Shift
-
Introduction to Neural Networks
-
Installing TensorFlow for Deep Learning - OPTIONAL
-
Introduction to Deep Learning with TensorFlow
-
Deep Learning with TensorFlow - Creating the Neural Network Model
-
Deep Learning with TensorFlow - How the Network will run
-
Deep Learning with our own Data
-
Simple Preprocessing Language Data for Deep Learning
-
Training and Testing on our Data for Deep Learning
-
10K samples compared to 1.6 million samples with Deep Learning
-
How to use CUDA and the GPU Version of Tensorflow for Deep Learning
-
Recurrent Neural Network (RNN) basics and the Long Short Term Memory (LSTM) cell
-
RNN w/ LSTM cell example in TensorFlow and Python
-
Convolutional Neural Network (CNN) basics
-
Convolutional Neural Network CNN with TensorFlow tutorial
-
TFLearn - High Level Abstraction Layer for TensorFlow Tutorial
-
Using a 3D Convolutional Neural Network on medical imaging data (CT Scans) for Kaggle
-
Classifying Cats vs Dogs with a Convolutional Neural Network on Kaggle
-
Using a neural network to solve OpenAI's CartPole balancing environment
