Creating a K Nearest Neighbors Classifer from scratch part 2
Welcome to the 17th part of our Machine Learning with Python tutorial series, where we're currently covering classification with the K Nearest Neighbors algorithm. In the previous tutorial, we began structuring our K Nearest Neighbors example, and here we're going to finish it.
The way I am going to handle this task is to create a Python list, which will contain another list, which will contain the distance, followed by the class, per point in our dataset. Once populated, we can sort the list by distance, take the first k values from that list, find the most popular, and we have our answer!
def k_nearest_neighbors(data, predict, k=3):
    if len(data) >= k:
        warnings.warn('K is set to a value less than total voting groups!')

    distances = []
    for group in data:
        for features in data[group]:
            euclidean_distance = sqrt( (features[0]-predict[0])**2 + (features[1]-predict[1])**2 )
            distances.append([euclidean_distance,group])
That's one way to calculate Euclidean distance, and it's the most clear when it comes to being obvious about following the definition. That said, using NumPy is going to be quite a bit faster. With KNN being a sort of brute-force method for machine learning, we need all the help we can get. Thus, we're going to modify the function a bit. One option could be:
            euclidean_distance = np.sqrt(np.sum((np.array(features)-np.array(predict))**2))
            print(euclidean_distance)
This is still relatively clear, we're just using the NumPy version of things. Numpy is a C-optimized and very efficient library, allowing us to perform math much quicker in many cases. That said, it turns out, Numpy actually has various linear algebra functions we can use. For example, there's norm (which is the same calculation we're looking for):
            euclidean_distance = np.linalg.norm(np.array(features)-np.array(predict))
            print(euclidean_distance)
Euclidean Distance is the name for measuring the length of a line segment between points. Euclidean Norm measures the magnitude of a vector. Magnitude of a vector is basically the length, and the equations are identical. The name just tells you in what space you're using it.
I am going to continue to use this last one, but I wanted to keep my promise that we'd break all this down easily into code. If you were not aware of Numpy's built in ability to do this, then you'd need to still know how to do it.
Now, outside of the for loop, we have the distances list which is a list that contains lists of distance and class. We want to sort that list, and then take the first k elements, taking the index of 1, which is the class.
votes = [i[1] for i in sorted(distances)[:k]]
Above, we're going through each list, within the distance list, which is sorted. The sort method will sort based on the first item in each list within the list. That first item is the distance, so when we do sorted(distances), we're sorting the list by shortest to greatest distance. Then we take the [:k] of this list, since we're interest in only k of the nearest neighbors. Finally, in the outermost layer of this for loop, we're taking i[0], where i was the list within the list, which contained [distance,class]. Beyond finding the k closest distances, we actually do not care what the distance was in this case, just the class now.
So these are the 3 votes, now we need to find the majority vote. We'll use Counter from the collections Python standard library module:
vote_result = Counter(votes).most_common(1)[0][0]
Collections finds the most common elements. In our case, we just want the single most common, but you can find the top 3 or top 'x.' Without doing the [0][0] part, you get [('r', 3)]. Thus, [0][0] gives us the first element in the tuple. The three you see is how many votes 'r' got.
Finally, you return the prediction and you're done. All together now:
def k_nearest_neighbors(data, predict, k=3):
    if len(data) >= k:
        warnings.warn('K is set to a value less than total voting groups!')

    distances = []
    for group in data:
        for features in data[group]:
            euclidean_distance = np.linalg.norm(np.array(features)-np.array(predict))
            distances.append([euclidean_distance,group])

    votes = [i[1] for i in sorted(distances)[:k]]
    vote_result = Counter(votes).most_common(1)[0][0]
    return vote_result
Now, if we want to make a prediction based on the plot we chose earlier:
result = k_nearest_neighbors(dataset, new_features)
print(result)
Sure enough, I get r, which was the hope. Let's graph it:
import numpy as np
import matplotlib.pyplot as plt
from matplotlib import style
import warnings
from math import sqrt
from collections import Counter
style.use('fivethirtyeight')

def k_nearest_neighbors(data, predict, k=3):
    if len(data) >= k:
        warnings.warn('K is set to a value less than total voting groups!')

    distances = []
    for group in data:
        for features in data[group]:
            euclidean_distance = np.linalg.norm(np.array(features)-np.array(predict))
            distances.append([euclidean_distance,group])

    votes = [i[1] for i in sorted(distances)[:k]]
    vote_result = Counter(votes).most_common(1)[0][0]
    return vote_result

dataset = {'k':[[1,2],[2,3],[3,1]], 'r':[[6,5],[7,7],[8,6]]}
new_features = [5,7]
[[plt.scatter(ii[0],ii[1],s=100,color=i) for ii in dataset[i]] for i in dataset]
# same as:
##for i in dataset:
##    for ii in dataset[i]:
##        plt.scatter(ii[0],ii[1],s=100,color=i)

plt.scatter(new_features[0], new_features[1], s=100)

result = k_nearest_neighbors(dataset, new_features)
plt.scatter(new_features[0], new_features[1], s=100, color = result)
plt.show()
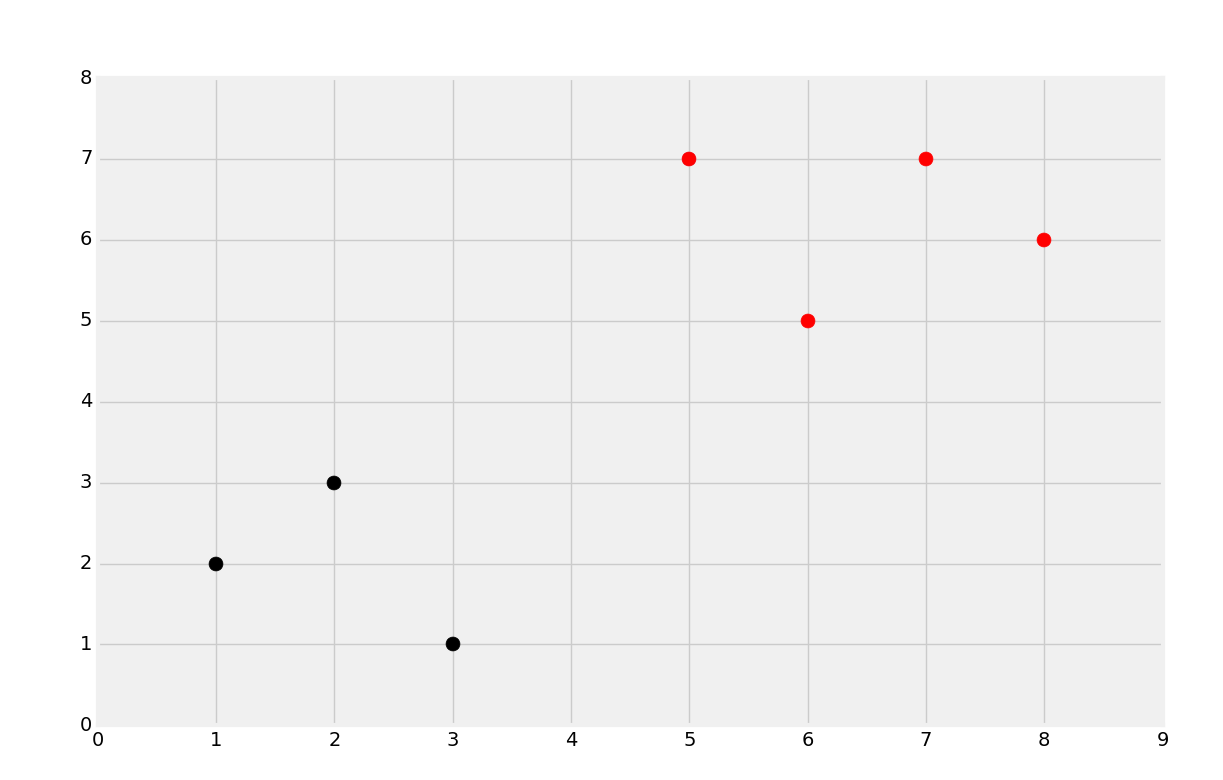
As you can see, we added a new plot, 5,7, and it has been classified as red as we had hoped.
Things have worked on a small scale, but how will we do on the breast cancer dataset? How will we compare to Scikit-Learn's rendition of K Nearest Neighbors? In the next tutorial, we'll apply our algorithm to that dataset to find out!
-
Practical Machine Learning Tutorial with Python Introduction
-
Regression - Intro and Data
-
Regression - Features and Labels
-
Regression - Training and Testing
-
Regression - Forecasting and Predicting
-
Pickling and Scaling
-
Regression - Theory and how it works
-
Regression - How to program the Best Fit Slope
-
Regression - How to program the Best Fit Line
-
Regression - R Squared and Coefficient of Determination Theory
-
Regression - How to Program R Squared
-
Creating Sample Data for Testing
-
Classification Intro with K Nearest Neighbors
-
Applying K Nearest Neighbors to Data
-
Euclidean Distance theory
-
Creating a K Nearest Neighbors Classifer from scratch
-
Creating a K Nearest Neighbors Classifer from scratch part 2
-
Testing our K Nearest Neighbors classifier
-
Final thoughts on K Nearest Neighbors
-
Support Vector Machine introduction
-
Vector Basics
-
Support Vector Assertions
-
Support Vector Machine Fundamentals
-
Constraint Optimization with Support Vector Machine
-
Beginning SVM from Scratch in Python
-
Support Vector Machine Optimization in Python
-
Support Vector Machine Optimization in Python part 2
-
Visualization and Predicting with our Custom SVM
-
Kernels Introduction
-
Why Kernels
-
Soft Margin Support Vector Machine
-
Kernels, Soft Margin SVM, and Quadratic Programming with Python and CVXOPT
-
Support Vector Machine Parameters
-
Machine Learning - Clustering Introduction
-
Handling Non-Numerical Data for Machine Learning
-
K-Means with Titanic Dataset
-
K-Means from Scratch in Python
-
Finishing K-Means from Scratch in Python
-
Hierarchical Clustering with Mean Shift Introduction
-
Mean Shift applied to Titanic Dataset
-
Mean Shift algorithm from scratch in Python
-
Dynamically Weighted Bandwidth for Mean Shift
-
Introduction to Neural Networks
-
Installing TensorFlow for Deep Learning - OPTIONAL
-
Introduction to Deep Learning with TensorFlow
-
Deep Learning with TensorFlow - Creating the Neural Network Model
-
Deep Learning with TensorFlow - How the Network will run
-
Deep Learning with our own Data
-
Simple Preprocessing Language Data for Deep Learning
-
Training and Testing on our Data for Deep Learning
-
10K samples compared to 1.6 million samples with Deep Learning
-
How to use CUDA and the GPU Version of Tensorflow for Deep Learning
-
Recurrent Neural Network (RNN) basics and the Long Short Term Memory (LSTM) cell
-
RNN w/ LSTM cell example in TensorFlow and Python
-
Convolutional Neural Network (CNN) basics
-
Convolutional Neural Network CNN with TensorFlow tutorial
-
TFLearn - High Level Abstraction Layer for TensorFlow Tutorial
-
Using a 3D Convolutional Neural Network on medical imaging data (CT Scans) for Kaggle
-
Classifying Cats vs Dogs with a Convolutional Neural Network on Kaggle
-
Using a neural network to solve OpenAI's CartPole balancing environment
