Finishing K-Means from Scratch in Python
Welcome to the 38th part of our machine learning tutorial series, and another tutorial within the topic of Clustering..
Where we left off, we have begun creating our own K Means clustering algorithm from scratch. We'll pick that up, starting with:
import matplotlib.pyplot as plt
from matplotlib import style
style.use('ggplot')
import numpy as np

X = np.array([[1, 2],
              [1.5, 1.8],
              [5, 8 ],
              [8, 8],
              [1, 0.6],
              [9,11]])

##plt.scatter(X[:,0], X[:,1], s=150)
##plt.show()

colors = 10*["g","r","c","b","k"]


class K_Means:
    def __init__(self, k=2, tol=0.001, max_iter=300):
        self.k = k
        self.tol = tol
        self.max_iter = max_iter

    def fit(self,data):

        self.centroids = {}

        for i in range(self.k):
            self.centroids[i] = data[i]

        for i in range(self.max_iter):
            self.classifications = {}

            for i in range(self.k):
                self.classifications[i] = []

            for featureset in data:
                distances = [np.linalg.norm(featureset-self.centroids[centroid]) for centroid in self.centroids]
                classification = distances.index(min(distances))
                self.classifications[classification].append(featureset)

            prev_centroids = dict(self.centroids)

            for classification in self.classifications:
                self.centroids[classification] = np.average(self.classifications[classification],axis=0)
Now that we have new centroids, and knowledge of the previous centroids, we're curious if we're optimized yet. Easy enough, we will add the following to the end of the fit method:
            optimized = True

            for c in self.centroids:
                original_centroid = prev_centroids[c]
                current_centroid = self.centroids[c]
                if np.sum((current_centroid-original_centroid)/original_centroid*100.0) > self.tol:
                    print(np.sum((current_centroid-original_centroid)/original_centroid*100.0))
                    optimized = False
We start off assuming we are optimized. We then take all of the centroids, and compare them to the previous centroids. If they are within our required tolerance, then we're happy. If not, then we set optimized to False and we continue in our for for i in range(self.max_iter): loop. If we are optimized?
            if optimized:
                break
We're done with the fit method:
    def fit(self,data):

        self.centroids = {}

        for i in range(self.k):
            self.centroids[i] = data[i]

        for i in range(self.max_iter):
            self.classifications = {}

            for i in range(self.k):
                self.classifications[i] = []

            for featureset in data:
                distances = [np.linalg.norm(featureset-self.centroids[centroid]) for centroid in self.centroids]
                classification = distances.index(min(distances))
                self.classifications[classification].append(featureset)

            prev_centroids = dict(self.centroids)

            for classification in self.classifications:
                self.centroids[classification] = np.average(self.classifications[classification],axis=0)

            optimized = True

            for c in self.centroids:
                original_centroid = prev_centroids[c]
                current_centroid = self.centroids[c]
                if np.sum((current_centroid-original_centroid)/original_centroid*100.0) > self.tol:
                    print(np.sum((current_centroid-original_centroid)/original_centroid*100.0))
                    optimized = False

            if optimized:
                break
Now we can add some sort of prediction method. This is actually already done for us. Recall where we run through the featuresets in our data to assign clusters?
            for featureset in data:
                distances = [np.linalg.norm(featureset-self.centroids[centroid]) for centroid in self.centroids]
                classification = distances.index(min(distances))
                self.classifications[classification].append(featureset)
That's all our prediction class needs to do, minus the last line:
    def predict(self,data):
        distances = [np.linalg.norm(data-self.centroids[centroid]) for centroid in self.centroids]
        classification = distances.index(min(distances))
        return classification
Now we are done with the entire K Means class:
class K_Means:
    def __init__(self, k=2, tol=0.001, max_iter=300):
        self.k = k
        self.tol = tol
        self.max_iter = max_iter

    def fit(self,data):

        self.centroids = {}

        for i in range(self.k):
            self.centroids[i] = data[i]

        for i in range(self.max_iter):
            self.classifications = {}

            for i in range(self.k):
                self.classifications[i] = []

            for featureset in data:
                distances = [np.linalg.norm(featureset-self.centroids[centroid]) for centroid in self.centroids]
                classification = distances.index(min(distances))
                self.classifications[classification].append(featureset)

            prev_centroids = dict(self.centroids)

            for classification in self.classifications:
                self.centroids[classification] = np.average(self.classifications[classification],axis=0)

            optimized = True

            for c in self.centroids:
                original_centroid = prev_centroids[c]
                current_centroid = self.centroids[c]
                if np.sum((current_centroid-original_centroid)/original_centroid*100.0) > self.tol:
                    print(np.sum((current_centroid-original_centroid)/original_centroid*100.0))
                    optimized = False

            if optimized:
                break

    def predict(self,data):
        distances = [np.linalg.norm(data-self.centroids[centroid]) for centroid in self.centroids]
        classification = distances.index(min(distances))
        return classification
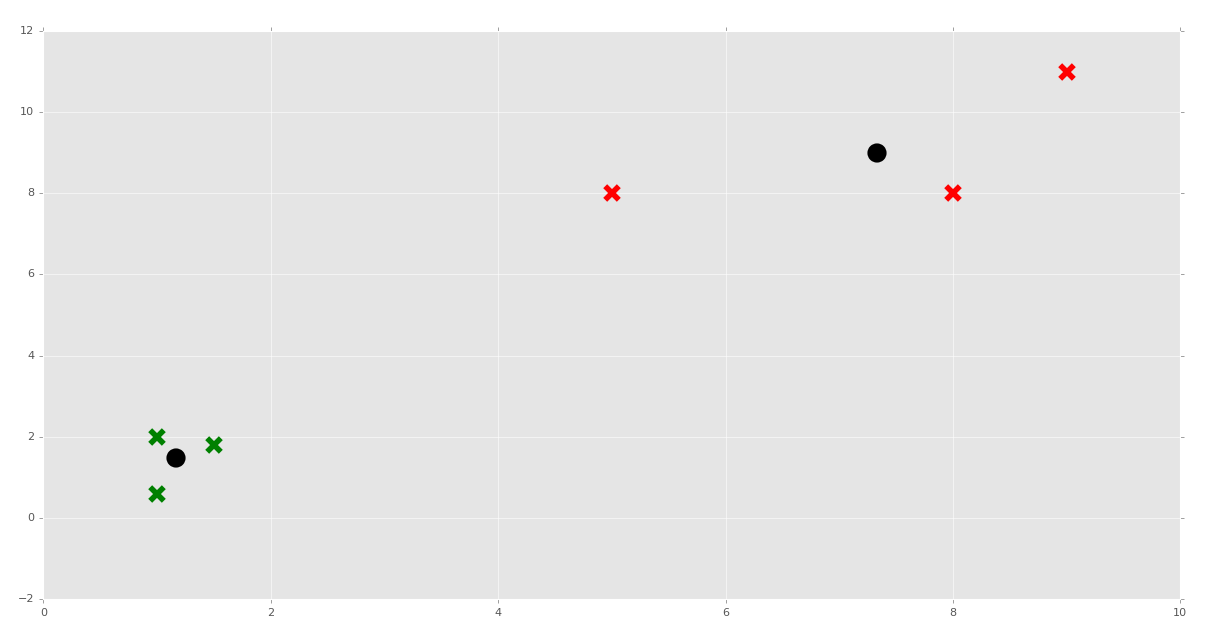
Now we can do something like:
clf = K_Means()
clf.fit(X)

for centroid in clf.centroids:
    plt.scatter(clf.centroids[centroid][0], clf.centroids[centroid][1],
                marker="o", color="k", s=150, linewidths=5)

for classification in clf.classifications:
    color = colors[classification]
    for featureset in clf.classifications[classification]:
        plt.scatter(featureset[0], featureset[1], marker="x", color=color, s=150, linewidths=5)

plt.show()
How about we test the predictions next?
clf = K_Means()
clf.fit(X)

for centroid in clf.centroids:
    plt.scatter(clf.centroids[centroid][0], clf.centroids[centroid][1],
                marker="o", color="k", s=150, linewidths=5)

for classification in clf.classifications:
    color = colors[classification]
    for featureset in clf.classifications[classification]:
        plt.scatter(featureset[0], featureset[1], marker="x", color=color, s=150, linewidths=5)


unknowns = np.array([[1,3],
                     [8,9],
                     [0,3],
                     [5,4],
                     [6,4],])

for unknown in unknowns:
    classification = clf.predict(unknown)
    plt.scatter(unknown[0], unknown[1], marker="*", color=colors[classification], s=150, linewidths=5)


plt.show()
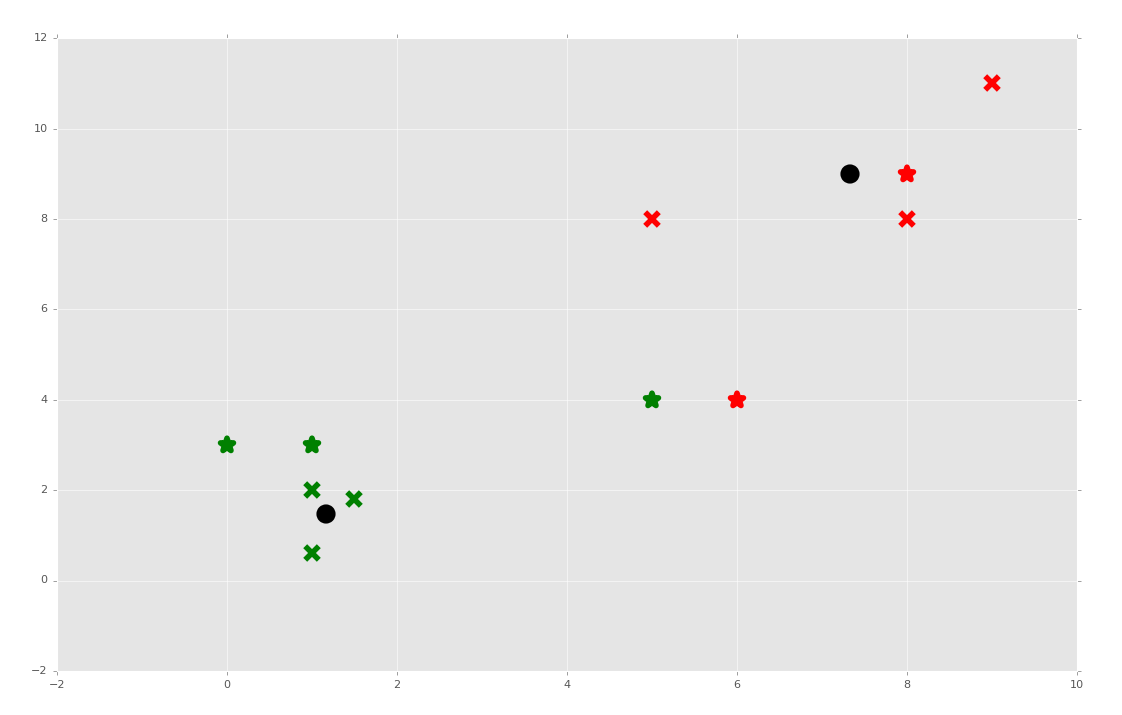
What if we took our predictions and added them to the original dataset? That would move the centroids, and would it possibly mean new classifications for any of the data?
import matplotlib.pyplot as plt
from matplotlib import style
style.use('ggplot')
import numpy as np

X = np.array([[1, 2],
              [1.5, 1.8],
              [5, 8 ],
              [8, 8],
              [1, 0.6],
              [9,11],
              [1,3],
              [8,9],
              [0,3],
              [5,4],
              [6,4],])

##plt.scatter(X[:,0], X[:,1], s=150)
##plt.show()

colors = 10*["g","r","c","b","k"]


class K_Means:
    def __init__(self, k=2, tol=0.001, max_iter=300):
        self.k = k
        self.tol = tol
        self.max_iter = max_iter

    def fit(self,data):

        self.centroids = {}

        for i in range(self.k):
            self.centroids[i] = data[i]

        for i in range(self.max_iter):
            self.classifications = {}

            for i in range(self.k):
                self.classifications[i] = []

            for featureset in data:
                distances = [np.linalg.norm(featureset-self.centroids[centroid]) for centroid in self.centroids]
                classification = distances.index(min(distances))
                self.classifications[classification].append(featureset)

            prev_centroids = dict(self.centroids)

            for classification in self.classifications:
                self.centroids[classification] = np.average(self.classifications[classification],axis=0)

            optimized = True

            for c in self.centroids:
                original_centroid = prev_centroids[c]
                current_centroid = self.centroids[c]
                if np.sum((current_centroid-original_centroid)/original_centroid*100.0) > self.tol:
                    print(np.sum((current_centroid-original_centroid)/original_centroid*100.0))
                    optimized = False

            if optimized:
                break

    def predict(self,data):
        distances = [np.linalg.norm(data-self.centroids[centroid]) for centroid in self.centroids]
        classification = distances.index(min(distances))
        return classification


clf = K_Means()
clf.fit(X)

for centroid in clf.centroids:
    plt.scatter(clf.centroids[centroid][0], clf.centroids[centroid][1],
                marker="o", color="k", s=150, linewidths=5)

for classification in clf.classifications:
    color = colors[classification]
    for featureset in clf.classifications[classification]:
        plt.scatter(featureset[0], featureset[1], marker="x", color=color, s=150, linewidths=5)

##unknowns = np.array([[1,3],
##                     [8,9],
##                     [0,3],
##                     [5,4],
##                     [6,4],])
##
##for unknown in unknowns:
##    classification = clf.predict(unknown)
##    plt.scatter(unknown[0], unknown[1], marker="*", color=colors[classification], s=150, linewidths=5)
##

plt.show()
Sure enough, while most featuresets kept their clusters, the featureset [5,4] changed groups when it was used for fitment.
There's K Means for you. If you ask me, K Means can be useful, along with other Flat Clustering algorithms, but it's still pretty lame that the programmer has to decide what K is. Our next topic is Hierarchical Clustering, which is where the machine figures out how many clusters to group featuresets into, which is a bit more impressive.
We can also test our K-Means algorithm against the Titanic set, and compare our results to reality and Scikit-Learn's output:
import matplotlib.pyplot as plt
from matplotlib import style
import numpy as np
from sklearn import preprocessing, cross_validation
import pandas as pd

##X = np.array([[1, 2],
##              [1.5, 1.8],
##              [5, 8],
##              [8, 8],
##              [1, 0.6],
##              [9, 11]])
##
##
##colors = ['r','g','b','c','k','o','y']


class K_Means:
    def __init__(self, k=2, tol=0.001, max_iter=300):
        self.k = k
        self.tol = tol
        self.max_iter = max_iter

    def fit(self,data):

        self.centroids = {}

        for i in range(self.k):
            self.centroids[i] = data[i]

        for i in range(self.max_iter):
            self.classifications = {}

            for i in range(self.k):
                self.classifications[i] = []

            for featureset in X:
                distances = [np.linalg.norm(featureset-self.centroids[centroid]) for centroid in self.centroids]
                classification = distances.index(min(distances))
                self.classifications[classification].append(featureset)

            prev_centroids = dict(self.centroids)

            for classification in self.classifications:
                self.centroids[classification] = np.average(self.classifications[classification],axis=0)

            optimized = True

            for c in self.centroids:
                original_centroid = prev_centroids[c]
                current_centroid = self.centroids[c]
                if np.sum((current_centroid-original_centroid)/original_centroid*100.0) > self.tol:
                    print(np.sum((current_centroid-original_centroid)/original_centroid*100.0))
                    optimized = False

            if optimized:
                break

    def predict(self,data):
        distances = [np.linalg.norm(data-self.centroids[centroid]) for centroid in self.centroids]
        classification = distances.index(min(distances))
        return classification


# https://pythonprogramming.net/static/downloads/machine-learning-data/titanic.xls
df = pd.read_excel('titanic.xls')
df.drop(['body','name'], 1, inplace=True)
#df.convert_objects(convert_numeric=True)
print(df.head())
df.fillna(0,inplace=True)

def handle_non_numerical_data(df):

    # handling non-numerical data: must convert.
    columns = df.columns.values

    for column in columns:
        text_digit_vals = {}
        def convert_to_int(val):
            return text_digit_vals[val]

        #print(column,df[column].dtype)
        if df[column].dtype != np.int64 and df[column].dtype != np.float64:

            column_contents = df[column].values.tolist()
            #finding just the uniques
            unique_elements = set(column_contents)
            # great, found them.
            x = 0
            for unique in unique_elements:
                if unique not in text_digit_vals:
                    # creating dict that contains new
                    # id per unique string
                    text_digit_vals[unique] = x
                    x+=1
            # now we map the new "id" vlaue
            # to replace the string.
            df[column] = list(map(convert_to_int,df[column]))

    return df

df = handle_non_numerical_data(df)
print(df.head())

# add/remove features just to see impact they have.
df.drop(['ticket','home.dest'], 1, inplace=True)


X = np.array(df.drop(['survived'], 1).astype(float))
X = preprocessing.scale(X)
y = np.array(df['survived'])

#X_train, X_test, y_train, y_test = cross_validation.train_test_split(X, y, test_size=0.5)

clf = K_Means()
clf.fit(X)

correct = 0
for i in range(len(X)):

    predict_me = np.array(X[i].astype(float))
    predict_me = predict_me.reshape(-1, len(predict_me))
    prediction = clf.predict(predict_me)
    if prediction == y[i]:
        correct += 1


print(correct/len(X))
We've now completed the K Means section of this Machine Learning tutorial series. Next, we're going to cover the Mean Shift algorithm, which, unlike K-Means, clusters without the scientist needing to tell the algorithm how many clusters to choose.
There exists 2 quiz/question(s) for this tutorial. for access to these, video downloads, and no ads.
-
Practical Machine Learning Tutorial with Python Introduction
-
Regression - Intro and Data
-
Regression - Features and Labels
-
Regression - Training and Testing
-
Regression - Forecasting and Predicting
-
Pickling and Scaling
-
Regression - Theory and how it works
-
Regression - How to program the Best Fit Slope
-
Regression - How to program the Best Fit Line
-
Regression - R Squared and Coefficient of Determination Theory
-
Regression - How to Program R Squared
-
Creating Sample Data for Testing
-
Classification Intro with K Nearest Neighbors
-
Applying K Nearest Neighbors to Data
-
Euclidean Distance theory
-
Creating a K Nearest Neighbors Classifer from scratch
-
Creating a K Nearest Neighbors Classifer from scratch part 2
-
Testing our K Nearest Neighbors classifier
-
Final thoughts on K Nearest Neighbors
-
Support Vector Machine introduction
-
Vector Basics
-
Support Vector Assertions
-
Support Vector Machine Fundamentals
-
Constraint Optimization with Support Vector Machine
-
Beginning SVM from Scratch in Python
-
Support Vector Machine Optimization in Python
-
Support Vector Machine Optimization in Python part 2
-
Visualization and Predicting with our Custom SVM
-
Kernels Introduction
-
Why Kernels
-
Soft Margin Support Vector Machine
-
Kernels, Soft Margin SVM, and Quadratic Programming with Python and CVXOPT
-
Support Vector Machine Parameters
-
Machine Learning - Clustering Introduction
-
Handling Non-Numerical Data for Machine Learning
-
K-Means with Titanic Dataset
-
K-Means from Scratch in Python
-
Finishing K-Means from Scratch in Python
-
Hierarchical Clustering with Mean Shift Introduction
-
Mean Shift applied to Titanic Dataset
-
Mean Shift algorithm from scratch in Python
-
Dynamically Weighted Bandwidth for Mean Shift
-
Introduction to Neural Networks
-
Installing TensorFlow for Deep Learning - OPTIONAL
-
Introduction to Deep Learning with TensorFlow
-
Deep Learning with TensorFlow - Creating the Neural Network Model
-
Deep Learning with TensorFlow - How the Network will run
-
Deep Learning with our own Data
-
Simple Preprocessing Language Data for Deep Learning
-
Training and Testing on our Data for Deep Learning
-
10K samples compared to 1.6 million samples with Deep Learning
-
How to use CUDA and the GPU Version of Tensorflow for Deep Learning
-
Recurrent Neural Network (RNN) basics and the Long Short Term Memory (LSTM) cell
-
RNN w/ LSTM cell example in TensorFlow and Python
-
Convolutional Neural Network (CNN) basics
-
Convolutional Neural Network CNN with TensorFlow tutorial
-
TFLearn - High Level Abstraction Layer for TensorFlow Tutorial
-
Using a 3D Convolutional Neural Network on medical imaging data (CT Scans) for Kaggle
-
Classifying Cats vs Dogs with a Convolutional Neural Network on Kaggle
-
Using a neural network to solve OpenAI's CartPole balancing environment
