Regression - R Squared and Coefficient of Determination Theory
Welcome to the 10th part of our of our machine learning regression tutorial within our Machine Learning with Python tutorial series. We've just recently finished creating a working linear regression model, and now we're curious what is next. Right now, we can easily look at the data, and decide how "accurate" the regression line is to some degree. What happens, however, when your linear regression model is applied within 20 hierarchical layers in a neural network? Not only this, but your model works in steps, or windows, of say 100 data points at a time, within a dataset of 5 million datapoints. You're going to need some sort of automated way of discovering how good your best fit line actually is.
Recall earlier when we showed various plots, you could already begin to see how likely a best-fit line would be a good overall fit or not, such as in the case of:
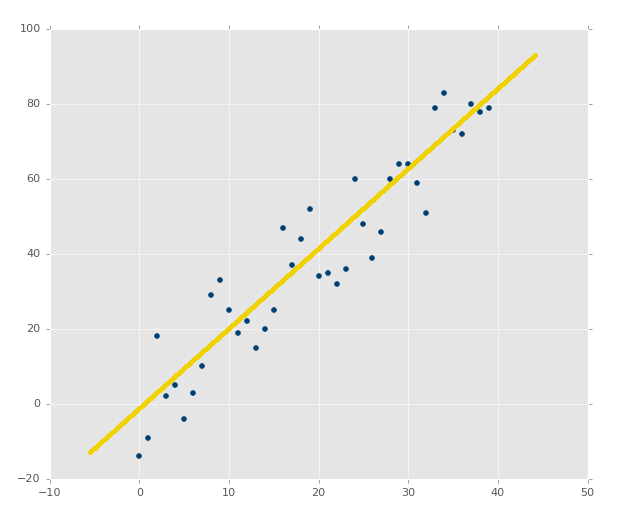
Compared to something like:
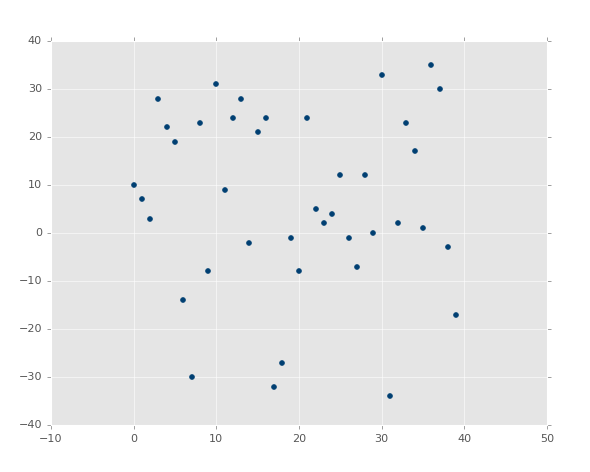
In the second image, there is a best fit line, but who cares. Even the best fitting line is still going to be useless, and we'd like to know that before we spend precious computational power on it.
The standard way to check for errors is by using squared errors. You will hear this method either called r squared or the coefficient of determination. So what is squared error?
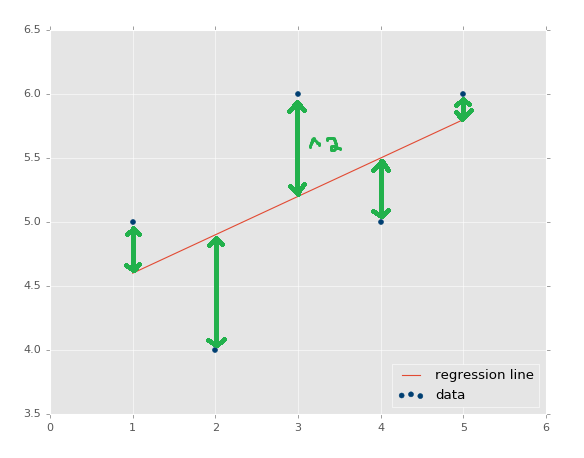
The distance between the regression line's y values, and the data's y values is the error, then we square that. The line's squared error is either a mean or a sum of this, we'll simply sum it.
We actually have already been working with a squared error assumption. Our best-fit line equation is the result of a proof that is used to discover the calculation for the best-fit regression line, where the regression line is the line that has the least squared error. You can search for "regression proof" or "best fit line proof" to get an understanding of the proof. It's fairly easy to follow, and is actually mostly just algebraic rearranging to come to the conclusion.
Why are we squaring errors? Why not just adding them up? First, we want a way to normalize the error as a distance, so the error might be -5, but, when squared, that's a positive number. Another reason is to further punish for outliers. The "further" off something is, the more the it affects the error. This is simply the standard people use. You could use the power of 4, 6, 8, or whatever. You could also just use the absolute value of the errors. If you have a unique challenge, maybe where some extreme outliers do exist, but you don't care to map them, you could consider doing something like an absolute value. If you care a lot about outliers, you could use much higher exponents. We'll stick with squared, as that is the standard almost everyone uses.
Alright, so we calculate squared error of the regression line, now what? What's that mean? Squared error is totally relative to the dataset, so we need something more. That's where "r squared" comes in, also called the "coefficient of determination." The equation for this is
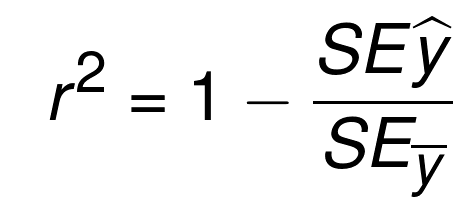
The equation is essentially 1 minus the division of the squared error of the regression line and the squared error of the mean y line. The mean y line is quite literally the mean of all of the y values from the dataset. If you were to graph it, then it would be a flat, horizontal, line. Thus, we do the squared error of the average y, and of the regression line. The objective here is to discern how much of the error is actually just simply a result in variation in the data features, as opposed to being a result of the regression line being a poor fit.
So, the coefficient of determination is the above equation, what do you think is good or bad? We see it's a 1 minus something. Typically, in math, when you see this, the objective is to return a percentage, some number between 0 and 1. What do you think would be a good r-squared/coefficient of determination? Let's say the answer to r-squared here is 0.8. Is that good or bad? Is it better or worse than 0.3? For r-squared to be 0.8, that means the division of the squared error of the regression line and the squared error of the mean of the ys was 0.2. Something like 2/10. That means the error of the regression line was far less than the error of the mean of the ys. Sounds like a good thing to me. Thus, 0.8 is pretty good.
What about compared to 0.3 as the value for the coefficient of determination? In that case, that would mean that the squared error of the regression line divided by the squared error of the mean of the ys line was 0.7. Something like 7/10 would generate this, where 7, in terms of being divided by 10 is far worse than the previous 2 divided by 10, where 7 and 2 are the squared errors of the regression line. Thus, the goal is to have the r squared value, otherwise called the coefficient of determination, as close to 1 as possible.
There exists 3 quiz/question(s) for this tutorial. for access to these, video downloads, and no ads.
-
Practical Machine Learning Tutorial with Python Introduction
-
Regression - Intro and Data
-
Regression - Features and Labels
-
Regression - Training and Testing
-
Regression - Forecasting and Predicting
-
Pickling and Scaling
-
Regression - Theory and how it works
-
Regression - How to program the Best Fit Slope
-
Regression - How to program the Best Fit Line
-
Regression - R Squared and Coefficient of Determination Theory
-
Regression - How to Program R Squared
-
Creating Sample Data for Testing
-
Classification Intro with K Nearest Neighbors
-
Applying K Nearest Neighbors to Data
-
Euclidean Distance theory
-
Creating a K Nearest Neighbors Classifer from scratch
-
Creating a K Nearest Neighbors Classifer from scratch part 2
-
Testing our K Nearest Neighbors classifier
-
Final thoughts on K Nearest Neighbors
-
Support Vector Machine introduction
-
Vector Basics
-
Support Vector Assertions
-
Support Vector Machine Fundamentals
-
Constraint Optimization with Support Vector Machine
-
Beginning SVM from Scratch in Python
-
Support Vector Machine Optimization in Python
-
Support Vector Machine Optimization in Python part 2
-
Visualization and Predicting with our Custom SVM
-
Kernels Introduction
-
Why Kernels
-
Soft Margin Support Vector Machine
-
Kernels, Soft Margin SVM, and Quadratic Programming with Python and CVXOPT
-
Support Vector Machine Parameters
-
Machine Learning - Clustering Introduction
-
Handling Non-Numerical Data for Machine Learning
-
K-Means with Titanic Dataset
-
K-Means from Scratch in Python
-
Finishing K-Means from Scratch in Python
-
Hierarchical Clustering with Mean Shift Introduction
-
Mean Shift applied to Titanic Dataset
-
Mean Shift algorithm from scratch in Python
-
Dynamically Weighted Bandwidth for Mean Shift
-
Introduction to Neural Networks
-
Installing TensorFlow for Deep Learning - OPTIONAL
-
Introduction to Deep Learning with TensorFlow
-
Deep Learning with TensorFlow - Creating the Neural Network Model
-
Deep Learning with TensorFlow - How the Network will run
-
Deep Learning with our own Data
-
Simple Preprocessing Language Data for Deep Learning
-
Training and Testing on our Data for Deep Learning
-
10K samples compared to 1.6 million samples with Deep Learning
-
How to use CUDA and the GPU Version of Tensorflow for Deep Learning
-
Recurrent Neural Network (RNN) basics and the Long Short Term Memory (LSTM) cell
-
RNN w/ LSTM cell example in TensorFlow and Python
-
Convolutional Neural Network (CNN) basics
-
Convolutional Neural Network CNN with TensorFlow tutorial
-
TFLearn - High Level Abstraction Layer for TensorFlow Tutorial
-
Using a 3D Convolutional Neural Network on medical imaging data (CT Scans) for Kaggle
-
Classifying Cats vs Dogs with a Convolutional Neural Network on Kaggle
-
Using a neural network to solve OpenAI's CartPole balancing environment
