Regression - Theory and how it works
Welcome to the seventh part of our machine learning regression tutorial within our Machine Learning with Python tutorial series. Up to this point, you have been shown the value of linear regression and how to apply it with Scikit Learn and Python, now we're going to dive into how it is calculated. While I do not believe it is necessary to dig into all of the math that goes into every machine learning algorithm (have you dug into the source code of your other favorite modules to see how they do every little thing?), linear algebra is essential to machine learning, and it is useful to understand the true building blocks that machine learning is built upon.
The objective of linear algebra is to calculate relationships of points in vector space. This is used for a variety of things, but one day, someone got the wild idea to do this with features of a dataset. We can too! Remember before when we defined the type of data that linear regression was going to work on was called "continuous" data? This is not so much due to what people just so happen to use linear regression for, it is due to the math that makes it up. Simple linear regression is used to find the best fit line of a dataset. If the data isn't continuous, there really isn't going to be a best fit line. Let's see some examples:
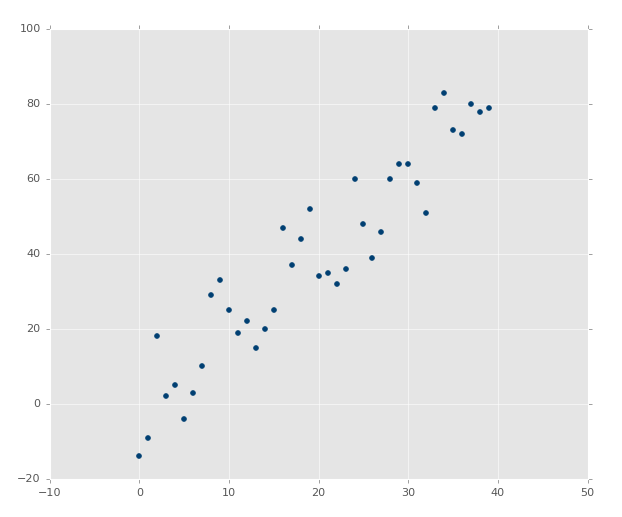
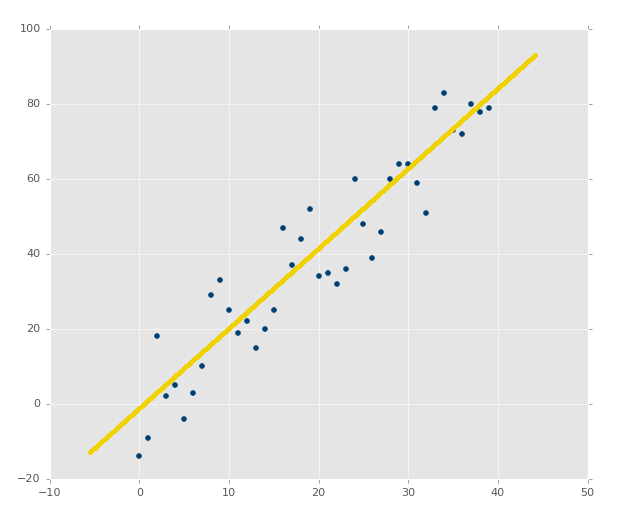
The above image clearly has a nice correlation. If you were asked to draw a best-fit line by estimation, you should be able to easily do something like this:
What about an image like:
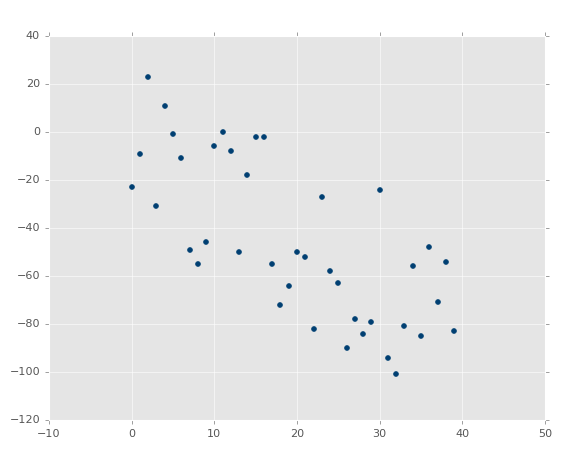
It is not AS obvious, but it is clearly a negative correlation. You could probably draw a best-fit line, but you're much more likely to not actually have the single best fit line in this case.
Finally, what about:
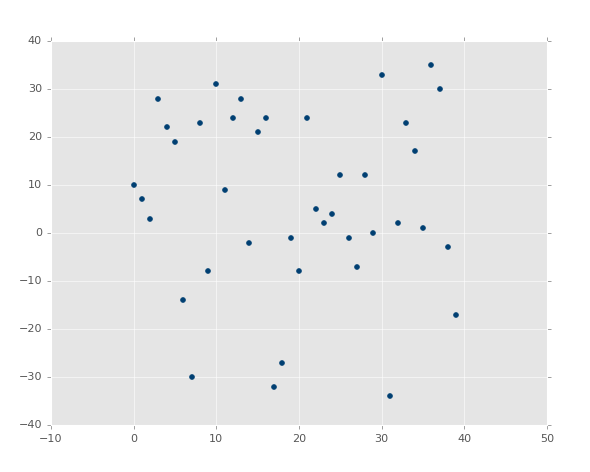
Well?! There is a best-fit line, but good luck figuring it out!
Consider the above images as graphs of features, so the X coordinates are the features and the Y coordinates are the associated labels. Does it appear that X and Y have any sort of seriously structured relationship? While we could calculate the exact relationship, it would be unlikely to have much value to us in the future.
In the cases of the other graphs, it was much more obvious that there was a relationship (the correlation) between X and Y. We can actually discover this relationship, and then plot along any point we wish. We could have a Y and predict an X, or an X and predict a Y, for any point we can think up. We can also predict to what degree of error we have with our model, and even if there's a point at all to the model. How can we do all of this magic? Linear Algebra!
First, let us take a trip back to middle school, where we brush up on the definition of a simple straight line: y = mx + b, where m is the slope and b is the y-intercept. This would be the equation used to discover y, and we could rearrange it instead to discover x using basic algebraic principles: x = (y-b) / m.
Alright, so, our objective is to find the best-fit line. Not just a good-fit line, the best one! The definition of this line will be y = mx + b. The y is the answer (our other coordinate, or it could even be our "feature"), so we'll still be needing m (the slope) and b (y-intercept), since x could be any possible point along the x-axis, so it is already known.
The slope, m, of the best-fit line is defined as:
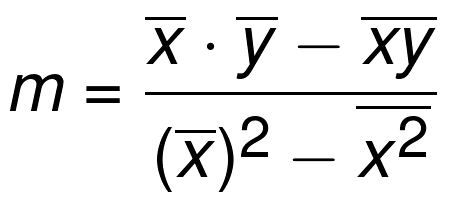
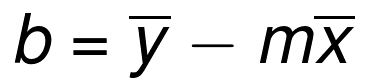
The bar over the letters signifies a mean/average. If two letters are sitting next to eachother, you multiply them. The xs and ys are from all of the existing coordinates. So we now know the m (the slope) of the best-fit line's definition in y=mx+b, now we just need the b (y intercept). There's a formula for that too:
Okay great! ...except the whole part where this isn't a math tutorial, it's a programming tutorial. That means we actually need to build a program to do this for us. In the next tutorial, we're going to do just that, as well as explain why I am going to have us programming it rather than using a module!
There exists 3 quiz/question(s) for this tutorial. for access to these, video downloads, and no ads.
-
Practical Machine Learning Tutorial with Python Introduction
-
Regression - Intro and Data
-
Regression - Features and Labels
-
Regression - Training and Testing
-
Regression - Forecasting and Predicting
-
Pickling and Scaling
-
Regression - Theory and how it works
-
Regression - How to program the Best Fit Slope
-
Regression - How to program the Best Fit Line
-
Regression - R Squared and Coefficient of Determination Theory
-
Regression - How to Program R Squared
-
Creating Sample Data for Testing
-
Classification Intro with K Nearest Neighbors
-
Applying K Nearest Neighbors to Data
-
Euclidean Distance theory
-
Creating a K Nearest Neighbors Classifer from scratch
-
Creating a K Nearest Neighbors Classifer from scratch part 2
-
Testing our K Nearest Neighbors classifier
-
Final thoughts on K Nearest Neighbors
-
Support Vector Machine introduction
-
Vector Basics
-
Support Vector Assertions
-
Support Vector Machine Fundamentals
-
Constraint Optimization with Support Vector Machine
-
Beginning SVM from Scratch in Python
-
Support Vector Machine Optimization in Python
-
Support Vector Machine Optimization in Python part 2
-
Visualization and Predicting with our Custom SVM
-
Kernels Introduction
-
Why Kernels
-
Soft Margin Support Vector Machine
-
Kernels, Soft Margin SVM, and Quadratic Programming with Python and CVXOPT
-
Support Vector Machine Parameters
-
Machine Learning - Clustering Introduction
-
Handling Non-Numerical Data for Machine Learning
-
K-Means with Titanic Dataset
-
K-Means from Scratch in Python
-
Finishing K-Means from Scratch in Python
-
Hierarchical Clustering with Mean Shift Introduction
-
Mean Shift applied to Titanic Dataset
-
Mean Shift algorithm from scratch in Python
-
Dynamically Weighted Bandwidth for Mean Shift
-
Introduction to Neural Networks
-
Installing TensorFlow for Deep Learning - OPTIONAL
-
Introduction to Deep Learning with TensorFlow
-
Deep Learning with TensorFlow - Creating the Neural Network Model
-
Deep Learning with TensorFlow - How the Network will run
-
Deep Learning with our own Data
-
Simple Preprocessing Language Data for Deep Learning
-
Training and Testing on our Data for Deep Learning
-
10K samples compared to 1.6 million samples with Deep Learning
-
How to use CUDA and the GPU Version of Tensorflow for Deep Learning
-
Recurrent Neural Network (RNN) basics and the Long Short Term Memory (LSTM) cell
-
RNN w/ LSTM cell example in TensorFlow and Python
-
Convolutional Neural Network (CNN) basics
-
Convolutional Neural Network CNN with TensorFlow tutorial
-
TFLearn - High Level Abstraction Layer for TensorFlow Tutorial
-
Using a 3D Convolutional Neural Network on medical imaging data (CT Scans) for Kaggle
-
Classifying Cats vs Dogs with a Convolutional Neural Network on Kaggle
-
Using a neural network to solve OpenAI's CartPole balancing environment
