Dynamically Weighted Bandwidth for Mean Shift
Welcome to the 42nd part of our machine learning tutorial series, and another tutorial within the topic of Clustering.. We're going to continue working on our custom Mean Shift algorithm from scratch.
Our code up to this point:
import matplotlib.pyplot as plt
from matplotlib import style
style.use('ggplot')
import numpy as np

X = np.array([[1, 2],
              [1.5, 1.8],
              [5, 8 ],
              [8, 8],
              [1, 0.6],
              [9,11],
              [8,2],
              [10,2],
              [9,3],])

##plt.scatter(X[:,0], X[:,1], s=150)
##plt.show()

colors = 10*["g","r","c","b","k"]

class Mean_Shift:
    def __init__(self, radius=4):
        self.radius = radius

    def fit(self, data):
        centroids = {}

        for i in range(len(data)):
            centroids[i] = data[i]

        while True:
            new_centroids = []
            for i in centroids:
                in_bandwidth = []
                centroid = centroids[i]
                for featureset in data:
                    if np.linalg.norm(featureset-centroid) < self.radius:
                        in_bandwidth.append(featureset)

                new_centroid = np.average(in_bandwidth,axis=0)
                new_centroids.append(tuple(new_centroid))

            uniques = sorted(list(set(new_centroids)))

            prev_centroids = dict(centroids)

            centroids = {}
            for i in range(len(uniques)):
                centroids[i] = np.array(uniques[i])

            optimized = True

            for i in centroids:
                if not np.array_equal(centroids[i], prev_centroids[i]):
                    optimized = False
                if not optimized:
                    break

            if optimized:
                break

        self.centroids = centroids


clf = Mean_Shift()
clf.fit(X)

centroids = clf.centroids

plt.scatter(X[:,0], X[:,1], s=150)

for c in centroids:
    plt.scatter(centroids[c][0], centroids[c][1], color='k', marker='*', s=150)

plt.show()
The code works, but we decided that the hard-coded radius is weak. We want something better! First, I will begin by modifying our __init___ method:
    def __init__(self, radius=None, radius_norm_step = 100):
        self.radius = radius
        self.radius_norm_step = radius_norm_step
So the plan here is to create a massive radius, but make that radius go in steps, like bandwidths, or a bunch of radiuses with different lengths, which we'll call steps. If a featureset is in the closest radius, it will have a much higher "weight" than one much further away. The only question is what those steps ought to be! Now, beginning our fit method:
    def fit(self, data):

        if self.radius == None:
            all_data_centroid = np.average(data, axis=0)
            all_data_norm = np.linalg.norm(all_data_centroid)
            self.radius = all_data_norm / self.radius_norm_step

        centroids = {}

        for i in range(len(data)):
            centroids[i] = data[i]
Here, if the user hasn't hard-coded the radius, then we're going to find the "center" of ALL of the data. Then, we will take the norm of that data, then we say each radius with self.radius is basically the full data-length, divided by how many steps we wanted to have. From here the centroids definitions remain the same as before in the above code. Now we begin the optimization while loop:
        weights = [i for i in range(self.radius_norm_step)][::-1]
        while True:
            new_centroids = []
            for i in centroids:
                in_bandwidth = []
                centroid = centroids[i]

                for featureset in data:
                    #if np.linalg.norm(featureset-centroid) < self.radius:
                    #    in_bandwidth.append(featureset)
                    distance = np.linalg.norm(featureset-centroid)
                    if distance == 0:
                        distance = 0.00000000001
                    weight_index = int(distance/self.radius)
                    if weight_index > self.radius_norm_step-1:
                        weight_index = self.radius_norm_step-1

                    to_add = (weights[weight_index]**2)*[featureset]
                    in_bandwidth +=to_add


                new_centroid = np.average(in_bandwidth,axis=0)
                new_centroids.append(tuple(new_centroid))

            uniques = sorted(list(set(new_centroids)))
Notice the definition of weights, and then the change within the for featureset in data. The weights list is just a simple list that we'll take how many "radius steps" a featureset is from the centroid, take those # of steps, treating them as index values for the weight list. Iterating through the features, we calculate distances, add weights, then add the "weighted" number of centroids to the in_bandwidth. When all done, we take the average of in_bandwidth, making that the new centroid.
Note that this weighting method is very cumbersome. There are better ways to do it, I am sure. This is simply what I came up with quickly, feel free to improve, and then share with us!
Next, before, all we had to do to note convergence was remove the centroids that were identical to eachother. With this method, however, it is highly likely that we have centroids that are extremely close, but not identical. We want to merge these too. For that, we do:
            to_pop = []

            for i in uniques:
                for ii in [i for i in uniques]:
                    if i == ii:
                        pass
                    elif np.linalg.norm(np.array(i)-np.array(ii)) <= self.radius:
                        #print(np.array(i), np.array(ii))
                        to_pop.append(ii)
                        break

            for i in to_pop:
                try:
                    uniques.remove(i)
                except:
                    pass
Again, this isn't elegance, but it will work. We continue along with code that was already here from the previous tutorial:
            prev_centroids = dict(centroids)
            centroids = {}
            for i in range(len(uniques)):
                centroids[i] = np.array(uniques[i])

            optimized = True

            for i in centroids:
                if not np.array_equal(centroids[i], prev_centroids[i]):
                    optimized = False

            if optimized:
                break


        self.centroids = centroids
Now, however, we kind of expect "fit" to also classify the existing featuresets. Let's add that in, still working within the fit method:
        self.classifications = {}

        for i in range(len(self.centroids)):
            self.classifications[i] = []

        for featureset in data:
            #compare distance to either centroid
            distances = [np.linalg.norm(featureset-self.centroids[centroid]) for centroid in self.centroids]
            #print(distances)
            classification = (distances.index(min(distances)))

            # featureset that belongs to that cluster
            self.classifications[classification].append(featureset)
All this does is take known featuresets, and calculate the minimum distance to the centroids, and classify as belonging to the closest centroid. Finally, we can take this code and also create a predict method as well:
    def predict(self,data):
        #compare distance to either centroid
        distances = [np.linalg.norm(data-self.centroids[centroid]) for centroid in self.centroids]
        classification = (distances.index(min(distances)))
        return classification
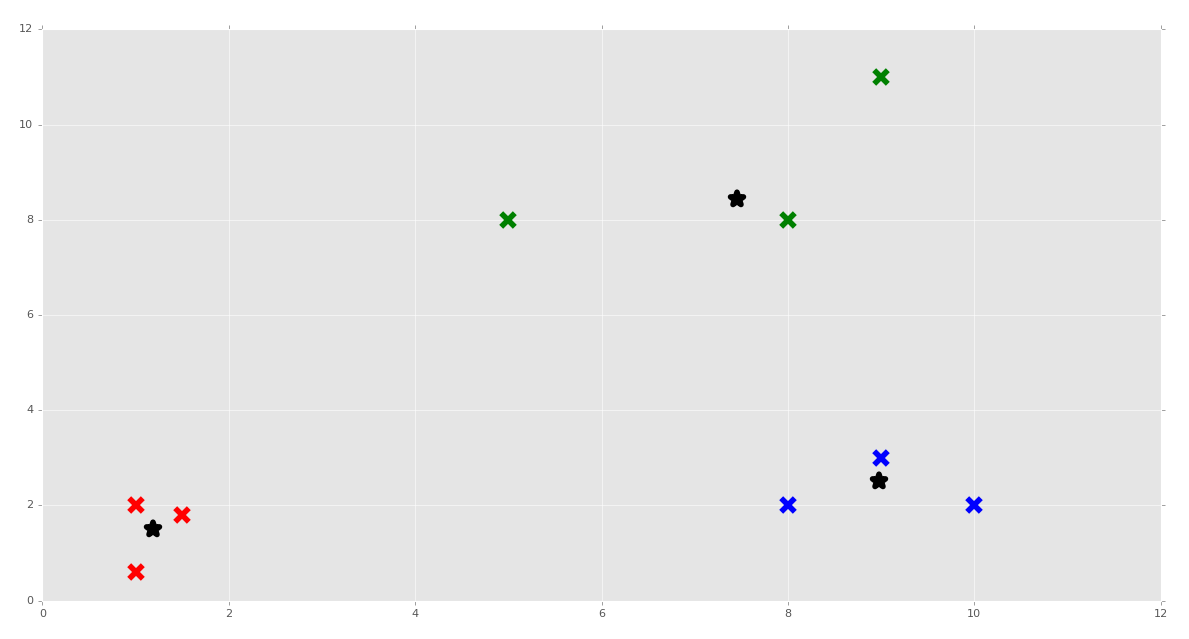
Great, the rest of the code stays the same at the end, but I will still put it here:
clf = Mean_Shift()
clf.fit(X)

centroids = clf.centroids
print(centroids)

colors = 10*['r','g','b','c','k','y']

for classification in clf.classifications:
    color = colors[classification]
    for featureset in clf.classifications[classification]:
        plt.scatter(featureset[0],featureset[1], marker = "x", color=color, s=150, linewidths = 5, zorder = 10)

for c in centroids:
    plt.scatter(centroids[c][0],centroids[c][1], color='k', marker = "*", s=150, linewidths = 5)

plt.show()
Awesome! We can put our clustering algorithm through a real stress test with Scikit-Learn's make_blobs, which we can use to create featuresets.
At the top of the script, you can do:
from sklearn.datasets.samples_generator import make_blobs
Then for our featuresets:
X, y = make_blobs(n_samples=15, centers=3, n_features=2)
Make sure you delete or comment out the previous definition for X.
Full code up to this point:
import matplotlib.pyplot as plt
from matplotlib import style
import numpy as np
from sklearn.datasets.samples_generator import make_blobs

style.use('ggplot')

X, y = make_blobs(n_samples=15, centers=3, n_features=2)
##X = np.array([[1, 2],
##              [1.5, 1.8],
##              [5, 8],
##              [8, 8],
##              [1, 0.6],
##              [9, 11],
##              [8, 2],
##              [10, 2],
##              [9, 3]])


##plt.scatter(X[:, 0],X[:, 1], marker = "x", s=150, linewidths = 5, zorder = 10)
##plt.show()

'''
1. Start at every datapoint as a cluster center

2. take mean of radius around cluster, setting that as new cluster center

3. Repeat #2 until convergence.

'''


class Mean_Shift:
    def __init__(self, radius = None, radius_norm_step = 100):
        self.radius = radius
        self.radius_norm_step = radius_norm_step

    def fit(self,data):

        if self.radius == None:
            all_data_centroid = np.average(data,axis=0)
            all_data_norm = np.linalg.norm(all_data_centroid)
            self.radius = all_data_norm/self.radius_norm_step
            print(self.radius)

        centroids = {}

        for i in range(len(data)):
            centroids[i] = data[i]

        weights = [i for i in range(self.radius_norm_step)][::-1]
        while True:
            new_centroids = []
            for i in centroids:
                in_bandwidth = []
                centroid = centroids[i]

                for featureset in data:

                    distance = np.linalg.norm(featureset-centroid)
                    if distance == 0:
                        distance = 0.00000000001
                    weight_index = int(distance/self.radius)
                    if weight_index > self.radius_norm_step-1:
                        weight_index = self.radius_norm_step-1

                    to_add = (weights[weight_index]**2)*[featureset]
                    in_bandwidth +=to_add

                new_centroid = np.average(in_bandwidth,axis=0)
                new_centroids.append(tuple(new_centroid))

            uniques = sorted(list(set(new_centroids)))

            to_pop = []

            for i in uniques:
                for ii in [i for i in uniques]:
                    if i == ii:
                        pass
                    elif np.linalg.norm(np.array(i)-np.array(ii)) <= self.radius:
                        #print(np.array(i), np.array(ii))
                        to_pop.append(ii)
                        break

            for i in to_pop:
                try:
                    uniques.remove(i)
                except:
                    pass

            prev_centroids = dict(centroids)
            centroids = {}
            for i in range(len(uniques)):
                centroids[i] = np.array(uniques[i])

            optimized = True

            for i in centroids:
                if not np.array_equal(centroids[i], prev_centroids[i]):
                    optimized = False

            if optimized:
                break

        self.centroids = centroids
        self.classifications = {}

        for i in range(len(self.centroids)):
            self.classifications[i] = []

        for featureset in data:
            #compare distance to either centroid
            distances = [np.linalg.norm(featureset-self.centroids[centroid]) for centroid in self.centroids]
            #print(distances)
            classification = (distances.index(min(distances)))

            # featureset that belongs to that cluster
            self.classifications[classification].append(featureset)


    def predict(self,data):
        #compare distance to either centroid
        distances = [np.linalg.norm(data-self.centroids[centroid]) for centroid in self.centroids]
        classification = (distances.index(min(distances)))
        return classification


clf = Mean_Shift()
clf.fit(X)

centroids = clf.centroids
print(centroids)

colors = 10*['r','g','b','c','k','y']

for classification in clf.classifications:
    color = colors[classification]
    for featureset in clf.classifications[classification]:
        plt.scatter(featureset[0],featureset[1], marker = "x", color=color, s=150, linewidths = 5, zorder = 10)

for c in centroids:
    plt.scatter(centroids[c][0],centroids[c][1], color='k', marker = "*", s=150, linewidths = 5)

plt.show()
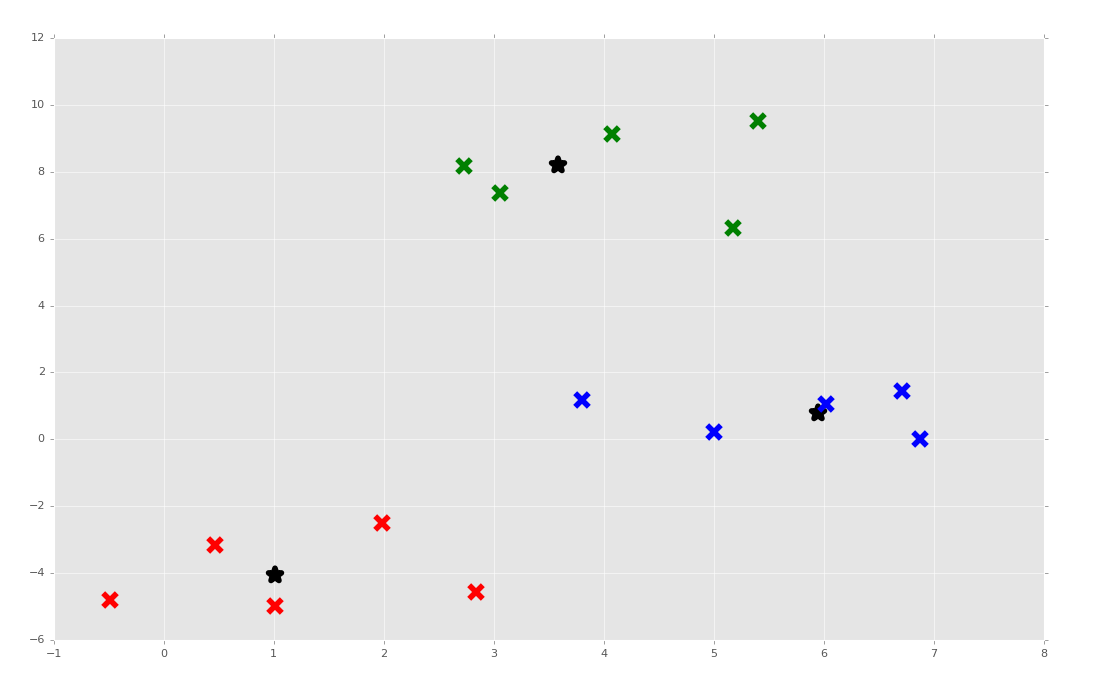
It doesn't always work. Sometimes it's because the clusters are pretty close. Other times I have really no idea when seeing the output, when it appears the output has obvious clusters. Maybe we're removing too many "duplicate" clusters and winding up with too few. No idea! Regardless, I am giving myself a passing grade and we're moving on to the coveted Artificial Neural Network next!
-
Practical Machine Learning Tutorial with Python Introduction
-
Regression - Intro and Data
-
Regression - Features and Labels
-
Regression - Training and Testing
-
Regression - Forecasting and Predicting
-
Pickling and Scaling
-
Regression - Theory and how it works
-
Regression - How to program the Best Fit Slope
-
Regression - How to program the Best Fit Line
-
Regression - R Squared and Coefficient of Determination Theory
-
Regression - How to Program R Squared
-
Creating Sample Data for Testing
-
Classification Intro with K Nearest Neighbors
-
Applying K Nearest Neighbors to Data
-
Euclidean Distance theory
-
Creating a K Nearest Neighbors Classifer from scratch
-
Creating a K Nearest Neighbors Classifer from scratch part 2
-
Testing our K Nearest Neighbors classifier
-
Final thoughts on K Nearest Neighbors
-
Support Vector Machine introduction
-
Vector Basics
-
Support Vector Assertions
-
Support Vector Machine Fundamentals
-
Constraint Optimization with Support Vector Machine
-
Beginning SVM from Scratch in Python
-
Support Vector Machine Optimization in Python
-
Support Vector Machine Optimization in Python part 2
-
Visualization and Predicting with our Custom SVM
-
Kernels Introduction
-
Why Kernels
-
Soft Margin Support Vector Machine
-
Kernels, Soft Margin SVM, and Quadratic Programming with Python and CVXOPT
-
Support Vector Machine Parameters
-
Machine Learning - Clustering Introduction
-
Handling Non-Numerical Data for Machine Learning
-
K-Means with Titanic Dataset
-
K-Means from Scratch in Python
-
Finishing K-Means from Scratch in Python
-
Hierarchical Clustering with Mean Shift Introduction
-
Mean Shift applied to Titanic Dataset
-
Mean Shift algorithm from scratch in Python
-
Dynamically Weighted Bandwidth for Mean Shift
-
Introduction to Neural Networks
-
Installing TensorFlow for Deep Learning - OPTIONAL
-
Introduction to Deep Learning with TensorFlow
-
Deep Learning with TensorFlow - Creating the Neural Network Model
-
Deep Learning with TensorFlow - How the Network will run
-
Deep Learning with our own Data
-
Simple Preprocessing Language Data for Deep Learning
-
Training and Testing on our Data for Deep Learning
-
10K samples compared to 1.6 million samples with Deep Learning
-
How to use CUDA and the GPU Version of Tensorflow for Deep Learning
-
Recurrent Neural Network (RNN) basics and the Long Short Term Memory (LSTM) cell
-
RNN w/ LSTM cell example in TensorFlow and Python
-
Convolutional Neural Network (CNN) basics
-
Convolutional Neural Network CNN with TensorFlow tutorial
-
TFLearn - High Level Abstraction Layer for TensorFlow Tutorial
-
Using a 3D Convolutional Neural Network on medical imaging data (CT Scans) for Kaggle
-
Classifying Cats vs Dogs with a Convolutional Neural Network on Kaggle
-
Using a neural network to solve OpenAI's CartPole balancing environment
