K-Means from Scratch in Python
Welcome to the 37th part of our machine learning tutorial series, and another tutorial within the topic of Clustering..
In this tutorial, we're going to be building our own K Means algorithm from scratch. Recall the methodology for the K Means algorithm:
- Choose value for K
- Randomly select K featuresets to start as your centroids
- Calculate distance of all other featuresets to centroids
- Classify other featuresets as same as closest centroid
- Take mean of each class (mean of all featuresets by class), making that mean the new centroid
- Repeat steps 3-5 until optimized (centroids no longer moving)
To begin, we will start with:
import matplotlib.pyplot as plt
from matplotlib import style
style.use('ggplot')
import numpy as np

X = np.array([[1, 2],
              [1.5, 1.8],
              [5, 8 ],
              [8, 8],
              [1, 0.6],
              [9,11]])

plt.scatter(X[:,0], X[:,1], s=150)
plt.show()
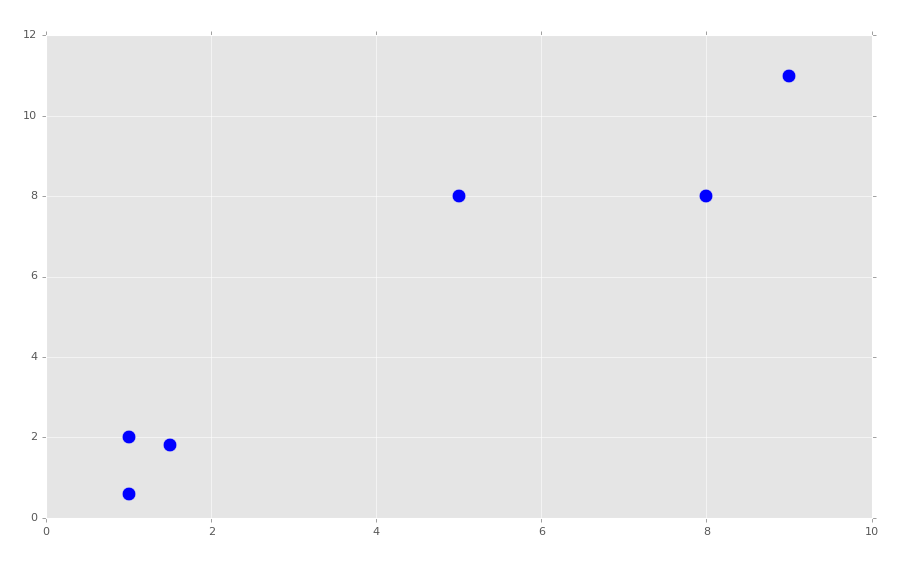
It should be obvious where our clusters are. We're going to be choosing K=2. We will begin building our K Means class:
class K_Means:
    def __init__(self, k=2, tol=0.001, max_iter=300):
        self.k = k
        self.tol = tol
        self.max_iter = max_iter
We just set up some starting values here, k is ...well... k. The tol value is our tolerance, which will allow us to say we're optimized if the centroid is not moving more than the tolerance value. The max_iter value is to limit the number of cycles we're willing to run.
Now we'll begin working on the fit method:
    def fit(self,data):

        self.centroids = {}

        for i in range(self.k):
            self.centroids[i] = data[i]
To begin, we know we just need to pass whatever data we're fitting to. We then begin an empty dictionary, which will soon house our centroids. Next, we begin a for loop which simply assigns our starting centroids as the first two data samples in our data. If you wanted to truly select randomly the starting centroids, you could first shuffle the data, but this should be fine.
Continuing to build the class:
class K_Means:
    def __init__(self, k=2, tol=0.001, max_iter=300):
        self.k = k
        self.tol = tol
        self.max_iter = max_iter

    def fit(self,data):

        self.centroids = {}

        for i in range(self.k):
            self.centroids[i] = data[i]

        for i in range(self.max_iter):
            self.classifications = {}

            for i in range(self.k):
                self.classifications[i] = []
Now we begin iterating through our max_iter value. While here, we start with empty classifications, and then create two dict keys (by iterating through range of self.k).
Next, we need to iterate through our features, calculate distances of the features to the current centroids, and classify them as such:
class K_Means:
    def __init__(self, k=2, tol=0.001, max_iter=300):
        self.k = k
        self.tol = tol
        self.max_iter = max_iter

    def fit(self,data):

        self.centroids = {}

        for i in range(self.k):
            self.centroids[i] = data[i]

        for i in range(self.max_iter):
            self.classifications = {}

            for i in range(self.k):
                self.classifications[i] = []

            for featureset in data:
                distances = [np.linalg.norm(featureset-self.centroids[centroid]) for centroid in self.centroids]
                classification = distances.index(min(distances))
                self.classifications[classification].append(featureset)
Next, we're going to need to create the new centroids, as well as measuring the movement of the centroids. If that movement is less than our tolerance (self.tol), then we're all set. Including that addition, full code up to this point:
import matplotlib.pyplot as plt
from matplotlib import style
style.use('ggplot')
import numpy as np

X = np.array([[1, 2],
              [1.5, 1.8],
              [5, 8 ],
              [8, 8],
              [1, 0.6],
              [9,11]])

plt.scatter(X[:,0], X[:,1], s=150)
plt.show()

colors = 10*["g","r","c","b","k"]


class K_Means:
    def __init__(self, k=2, tol=0.001, max_iter=300):
        self.k = k
        self.tol = tol
        self.max_iter = max_iter

    def fit(self,data):

        self.centroids = {}

        for i in range(self.k):
            self.centroids[i] = data[i]

        for i in range(self.max_iter):
            self.classifications = {}

            for i in range(self.k):
                self.classifications[i] = []

            for featureset in data:
                distances = [np.linalg.norm(featureset-self.centroids[centroid]) for centroid in self.centroids]
                classification = distances.index(min(distances))
                self.classifications[classification].append(featureset)

            prev_centroids = dict(self.centroids)

            for classification in self.classifications:
                self.centroids[classification] = np.average(self.classifications[classification],axis=0)
In the next tutorial, we'll finish our class and see how it performs!
-
Practical Machine Learning Tutorial with Python Introduction
-
Regression - Intro and Data
-
Regression - Features and Labels
-
Regression - Training and Testing
-
Regression - Forecasting and Predicting
-
Pickling and Scaling
-
Regression - Theory and how it works
-
Regression - How to program the Best Fit Slope
-
Regression - How to program the Best Fit Line
-
Regression - R Squared and Coefficient of Determination Theory
-
Regression - How to Program R Squared
-
Creating Sample Data for Testing
-
Classification Intro with K Nearest Neighbors
-
Applying K Nearest Neighbors to Data
-
Euclidean Distance theory
-
Creating a K Nearest Neighbors Classifer from scratch
-
Creating a K Nearest Neighbors Classifer from scratch part 2
-
Testing our K Nearest Neighbors classifier
-
Final thoughts on K Nearest Neighbors
-
Support Vector Machine introduction
-
Vector Basics
-
Support Vector Assertions
-
Support Vector Machine Fundamentals
-
Constraint Optimization with Support Vector Machine
-
Beginning SVM from Scratch in Python
-
Support Vector Machine Optimization in Python
-
Support Vector Machine Optimization in Python part 2
-
Visualization and Predicting with our Custom SVM
-
Kernels Introduction
-
Why Kernels
-
Soft Margin Support Vector Machine
-
Kernels, Soft Margin SVM, and Quadratic Programming with Python and CVXOPT
-
Support Vector Machine Parameters
-
Machine Learning - Clustering Introduction
-
Handling Non-Numerical Data for Machine Learning
-
K-Means with Titanic Dataset
-
K-Means from Scratch in Python
-
Finishing K-Means from Scratch in Python
-
Hierarchical Clustering with Mean Shift Introduction
-
Mean Shift applied to Titanic Dataset
-
Mean Shift algorithm from scratch in Python
-
Dynamically Weighted Bandwidth for Mean Shift
-
Introduction to Neural Networks
-
Installing TensorFlow for Deep Learning - OPTIONAL
-
Introduction to Deep Learning with TensorFlow
-
Deep Learning with TensorFlow - Creating the Neural Network Model
-
Deep Learning with TensorFlow - How the Network will run
-
Deep Learning with our own Data
-
Simple Preprocessing Language Data for Deep Learning
-
Training and Testing on our Data for Deep Learning
-
10K samples compared to 1.6 million samples with Deep Learning
-
How to use CUDA and the GPU Version of Tensorflow for Deep Learning
-
Recurrent Neural Network (RNN) basics and the Long Short Term Memory (LSTM) cell
-
RNN w/ LSTM cell example in TensorFlow and Python
-
Convolutional Neural Network (CNN) basics
-
Convolutional Neural Network CNN with TensorFlow tutorial
-
TFLearn - High Level Abstraction Layer for TensorFlow Tutorial
-
Using a 3D Convolutional Neural Network on medical imaging data (CT Scans) for Kaggle
-
Classifying Cats vs Dogs with a Convolutional Neural Network on Kaggle
-
Using a neural network to solve OpenAI's CartPole balancing environment
