Basemap Geographic Plotting with Matplotlib
In this Matplotlib tutorial, we're going to be covering the geographic plotting module, Basemap. Basemap is an extension to Matplotlib.
In order to use Basemap, we first need it. To get Basemap, you can either get it from here: http://matplotlib.org/basemap/users/download.html, or you can go to http://www.lfd.uci.edu/~gohlke/pythonlibs/.
If you are having trouble installing Basemap, check out the pip installation tutorial.
Once you have Basemap installed, you're ready to create maps. First, let's just project a simple map. To do this, we need to import Basemap, pyplot, create the projection, draw at least some sort of outline or data, then we can show the graph.
from mpl_toolkits.basemap import Basemap
import matplotlib.pyplot as plt

m = Basemap(projection='mill')
m.drawcoastlines()
plt.show()
The above code should give you something like:
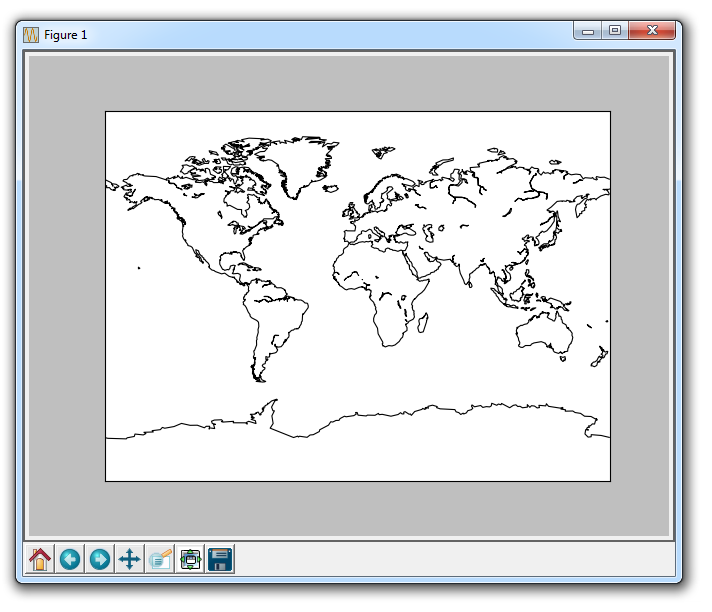
This is done using a Miller projection, which is just one of many Basemap Projection Options.
-
Introduction to Matplotlib and basic line
-
Legends, Titles, and Labels with Matplotlib
-
Bar Charts and Histograms with Matplotlib
-
Scatter Plots with Matplotlib
-
Stack Plots with Matplotlib
-
Pie Charts with Matplotlib
-
Loading Data from Files for Matplotlib
-
Data from the Internet for Matplotlib
-
Converting date stamps for Matplotlib
-
Basic customization with Matplotlib
-
Unix Time with Matplotlib
-
Colors and Fills with Matplotlib
-
Spines and Horizontal Lines with Matplotlib
-
Candlestick OHLC graphs with Matplotlib
-
Styles with Matplotlib
-
Live Graphs with Matplotlib
-
Annotations and Text with Matplotlib
-
Annotating Last Price Stock Chart with Matplotlib
-
Subplots with Matplotlib
-
Implementing Subplots to our Chart with Matplotlib
-
More indicator data with Matplotlib
-
Custom fills, pruning, and cleaning with Matplotlib
-
Share X Axis, sharex, with Matplotlib
-
Multi Y Axis with twinx Matplotlib
-
Custom Legends with Matplotlib
-
Basemap Geographic Plotting with Matplotlib
-
Basemap Customization with Matplotlib
-
Plotting Coordinates in Basemap with Matplotlib
-
3D graphs with Matplotlib
-
3D Scatter Plot with Matplotlib
-
3D Bar Chart with Matplotlib
-
Conclusion with Matplotlib
