Conclusion with Matplotlib
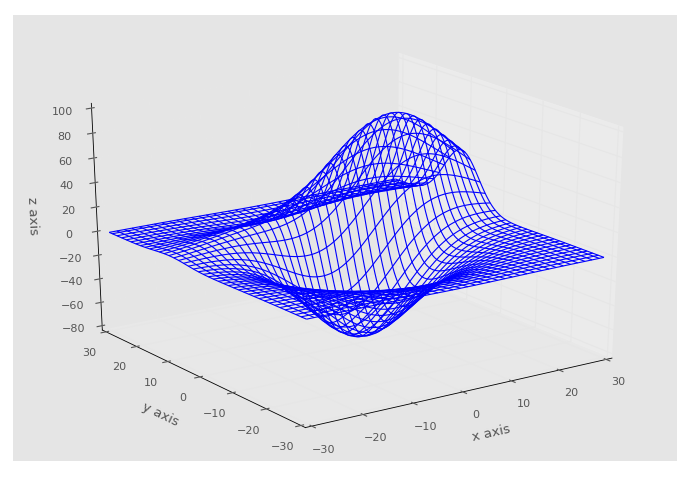
Welcome to the final Matplotlib tutorial video. Here we will wrap up the series, and show a slightly more complex 3D wireframe:
from mpl_toolkits.mplot3d import axes3d
import matplotlib.pyplot as plt
import numpy as np
from matplotlib import style
style.use('ggplot')

fig = plt.figure()
ax1 = fig.add_subplot(111, projection='3d')

x, y, z = axes3d.get_test_data()

print(axes3d.__file__)
ax1.plot_wireframe(x,y,z, rstride = 3, cstride = 3)

ax1.set_xlabel('x axis')
ax1.set_ylabel('y axis')
ax1.set_zlabel('z axis')

plt.show()
If you have followed along since the beginning, then you have learned most of what Matplotlib has to offer. You might not believe it, but there's still a lot of other things Matplotlib can do! Moving forward, you can always head to Matplotlib.org, and check out the examples and the gallery section.
If you find yourself extensively using Matplotlib, consider donating to the John Hunter Memorial Fund.
There exists 1 challenge(s) for this tutorial. for access to these, video downloads, and no ads.
That's all for now. For tutorials on other topics, head to the:
-
Introduction to Matplotlib and basic line
-
Legends, Titles, and Labels with Matplotlib
-
Bar Charts and Histograms with Matplotlib
-
Scatter Plots with Matplotlib
-
Stack Plots with Matplotlib
-
Pie Charts with Matplotlib
-
Loading Data from Files for Matplotlib
-
Data from the Internet for Matplotlib
-
Converting date stamps for Matplotlib
-
Basic customization with Matplotlib
-
Unix Time with Matplotlib
-
Colors and Fills with Matplotlib
-
Spines and Horizontal Lines with Matplotlib
-
Candlestick OHLC graphs with Matplotlib
-
Styles with Matplotlib
-
Live Graphs with Matplotlib
-
Annotations and Text with Matplotlib
-
Annotating Last Price Stock Chart with Matplotlib
-
Subplots with Matplotlib
-
Implementing Subplots to our Chart with Matplotlib
-
More indicator data with Matplotlib
-
Custom fills, pruning, and cleaning with Matplotlib
-
Share X Axis, sharex, with Matplotlib
-
Multi Y Axis with twinx Matplotlib
-
Custom Legends with Matplotlib
-
Basemap Geographic Plotting with Matplotlib
-
Basemap Customization with Matplotlib
-
Plotting Coordinates in Basemap with Matplotlib
-
3D graphs with Matplotlib
-
3D Scatter Plot with Matplotlib
-
3D Bar Chart with Matplotlib
-
Conclusion with Matplotlib
