Styles with Matplotlib
In this Matplotlib tutorial, we're going to be talking about styles. With Matplotlib, we have styles which serve a very similar purpose to Matplotlib graphs as CSS (cascading style sheet) pages serve for HTML. As you can see up to this point, all of these changes we're making to our graphs start to add up, and we only have one axis so far! We could use for loops to at least keep the amount of code down, but we can also make use of these styles with Matplotlib.
The idea of a style page is to write your customization to a style file, and then, to use those changes and apply them to your graph, all you do is import style and then use that specific style. This way, let's say you are finding yourself always changing various elements of your graphs. Instead of having to write 25-200 lines of customization code per chart, you can just write it once to a style, and then load in that style and apply all of those changes in two lines! Let's get started.
First, you will need to import the style module from matplotlib:
from matplotlib import style
Next, we specifiy what style we want to use. Matplotlib comes with a few styles already.
We can use a style like so:
style.use('ggplot')
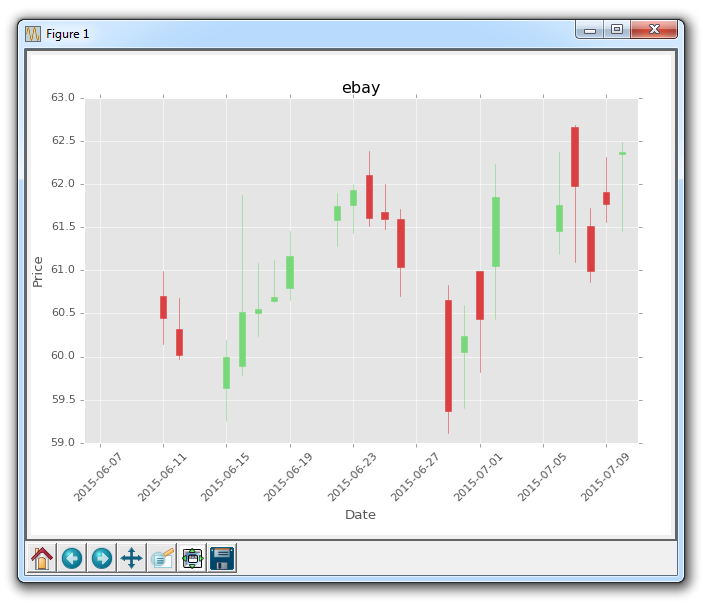
Doing this to our current chart is enough to give us:

Immediately, we can tell the font is different, besides the title, the color of labels are grey, and the axis background is a light grey. We also notice the grid is actually a solid white line. Our candlestick stays the same, mostly since we are the ones customizing it after the fact. When you load in a style, the changes are made, but, if you write new customization code after loading the style, your changes will occur.
Since we're trying to show off the styles module, however, let's go ahead and just plot a couple lines and comment out the candlestick for now:
    #candlestick_ohlc(ax1, ohlc, width=0.4, colorup='#77d879', colordown='#db3f3f')
    ax1.plot(date,closep)
    ax1.plot(date,openp)
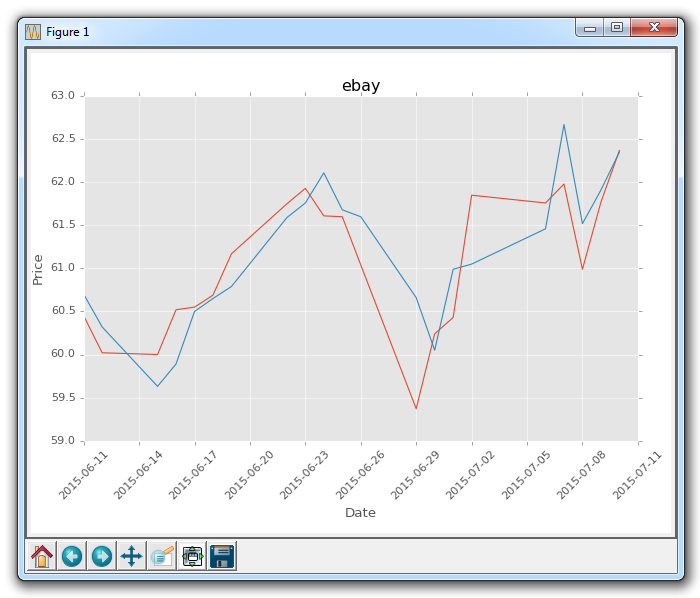
That gives us:

Already much better than the defaults!
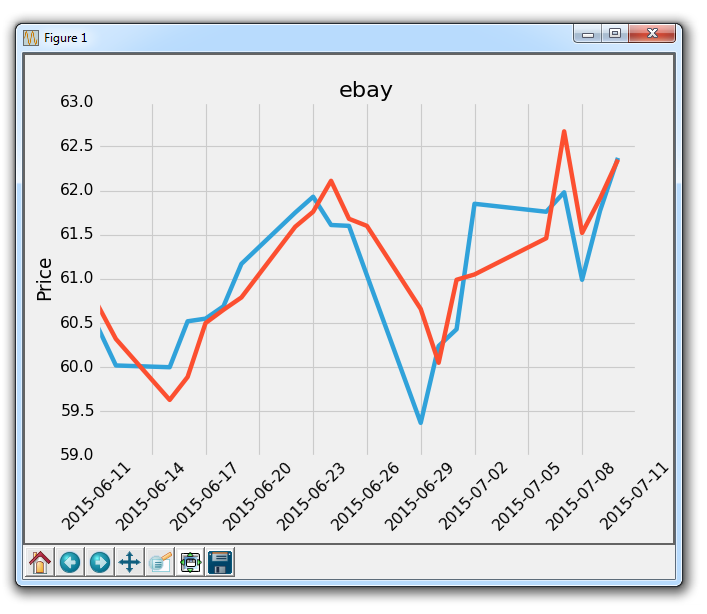
Another example of a style is from fivethirtyeight:
style.use('fivethirtyeight')

You can see all of the available styles you currently have by doing:
print(plt.style.available)
For me, that gives ['bmh', 'dark_background', 'ggplot', 'fivethirtyeight', 'grayscale']
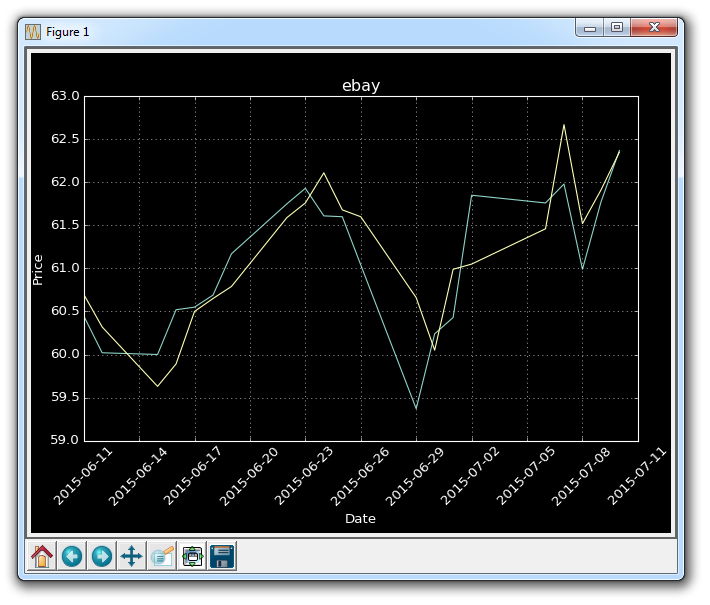
Let's try out the dark_background:
style.use('dark_background')

Now, what if you want to make your own styles? First, you need to find the style directory. To do this, you can either head to your matplotlib directory if you know where it is, or you can find that directory. If you do not know how to find that directory, you can do something like:
print(plt.__file__)
That tells you where the pyplot module is at least.
Within the matplotlib dir, you're looking for mpl-data. Then, in there, you're looking for stylelib. The full path to this for me, on Windows, is: C:\Python34\Lib\site-packages\matplotlib\mpl-data\stylelib
Heading there, should show you all of the .mplstyle files available. You can either edit these, or copy them, rename them, and then modify from there to be what you want. Then, whatever you name the .mplstyle file is what you would place in style.use.
There exists 1 quiz/question(s) for this tutorial. for access to these, video downloads, and no ads.
-
Introduction to Matplotlib and basic line
-
Legends, Titles, and Labels with Matplotlib
-
Bar Charts and Histograms with Matplotlib
-
Scatter Plots with Matplotlib
-
Stack Plots with Matplotlib
-
Pie Charts with Matplotlib
-
Loading Data from Files for Matplotlib
-
Data from the Internet for Matplotlib
-
Converting date stamps for Matplotlib
-
Basic customization with Matplotlib
-
Unix Time with Matplotlib
-
Colors and Fills with Matplotlib
-
Spines and Horizontal Lines with Matplotlib
-
Candlestick OHLC graphs with Matplotlib
-
Styles with Matplotlib
-
Live Graphs with Matplotlib
-
Annotations and Text with Matplotlib
-
Annotating Last Price Stock Chart with Matplotlib
-
Subplots with Matplotlib
-
Implementing Subplots to our Chart with Matplotlib
-
More indicator data with Matplotlib
-
Custom fills, pruning, and cleaning with Matplotlib
-
Share X Axis, sharex, with Matplotlib
-
Multi Y Axis with twinx Matplotlib
-
Custom Legends with Matplotlib
-
Basemap Geographic Plotting with Matplotlib
-
Basemap Customization with Matplotlib
-
Plotting Coordinates in Basemap with Matplotlib
-
3D graphs with Matplotlib
-
3D Scatter Plot with Matplotlib
-
3D Bar Chart with Matplotlib
-
Conclusion with Matplotlib
