Basemap Customization with Matplotlib
In this Matplotlib tutorial, we continue with the Basemap geographic plotting extension. We're going to show some of the customization options available to us.
First, taking our starting code from the previous tutorial:
from mpl_toolkits.basemap import Basemap
import matplotlib.pyplot as plt

m = Basemap(projection='mill')
m.drawcoastlines()
plt.show()
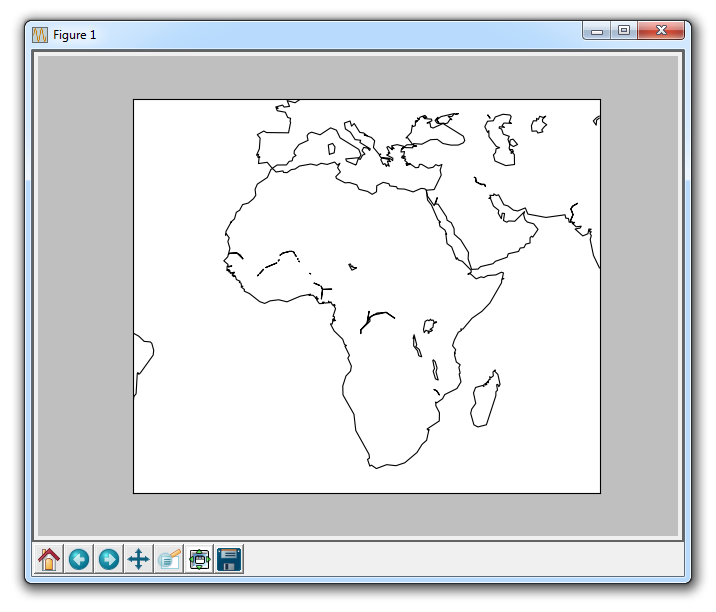
We can then start by zooming into specific areas like:
from mpl_toolkits.basemap import Basemap
import matplotlib.pyplot as plt

m = Basemap(projection='mill',
            llcrnrlat = -40,
            llcrnrlon = -40,
            urcrnrlat = 50,
            urcrnrlon = 75)
m.drawcoastlines()
plt.show()
The parameters here are:
- llcrnrlat - lower left corner latitude
- llcrnrlon - lower left corner longitude
- urcrnrlat - upper right corner latitude
- urcrnrlon - upper right corner longitude
Also, coordinates are converted, where western and southern coordinates are negatives, and the northern and eastern coordinates are positives.
With these coordinates, Basemap selects the area between them.
Next, we can use something like:
m.drawcountries(linewidth=2)
This will draw countries, and make their separating lines with a line width of 2.
Another option is:
m.drawstates(color='b')
This will draw states with blue lines.
You can also do:
m.drawcounties(color='darkred')
This draws counties.
So, with code currently like:
from mpl_toolkits.basemap import Basemap
import matplotlib.pyplot as plt

m = Basemap(projection='mill',
            llcrnrlat = -90,
            llcrnrlon = -180,
            urcrnrlat = 90,
            urcrnrlon = 180)

m.drawcoastlines()
m.drawcountries(linewidth=2)
m.drawstates(color='b')
m.drawcounties(color='darkred')

plt.title('Basemap Tutorial')
plt.show()
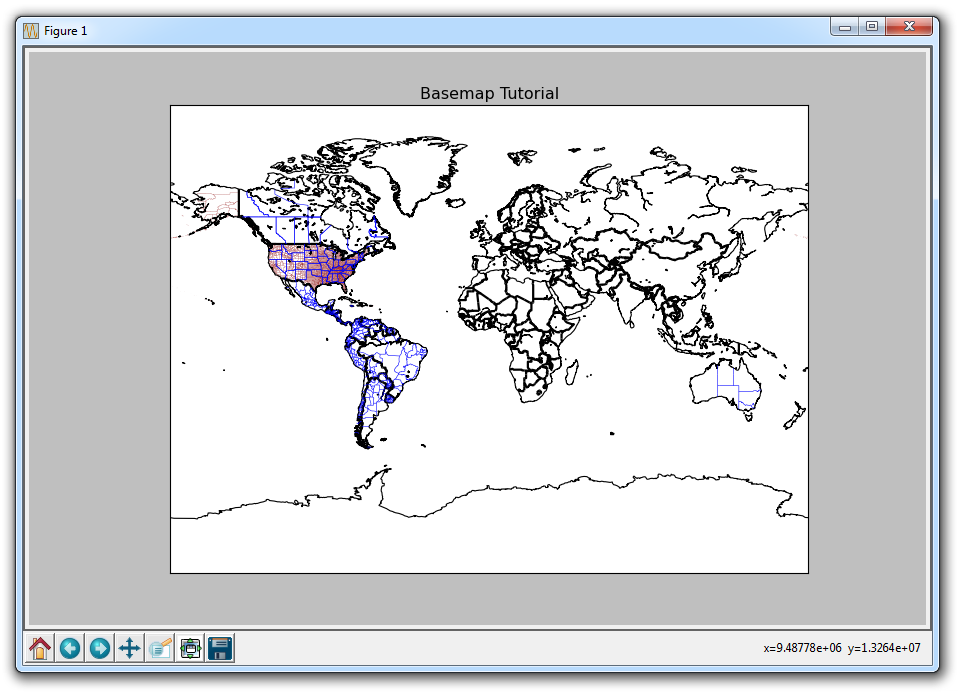
Hard to tell here, but we have defined county lines in the United States. We can zoom in to Basemap graphs like other graphs using the magnifying glass, giving us:

Another useful parameter is the "resolution" option with the Basemap call:
m = Basemap(projection='mill',
            llcrnrlat = -90,
            llcrnrlon = -180,
            urcrnrlat = 90,
            urcrnrlon = 180,
            resolution='l')
The resolution options:
- c - crude
- l - low
- h - high
- f - full
For the higher resolutions, you really should start zoomed in quite far, otherwise you're probably just wasting processing.
Another option is to plot topography with etopo(), like:
m.etopo()
Plotting this with the drawcountries method gives you:

Finally, there is a blue marbling version, which you can invoke with
m.bluemarble()
Giving you:
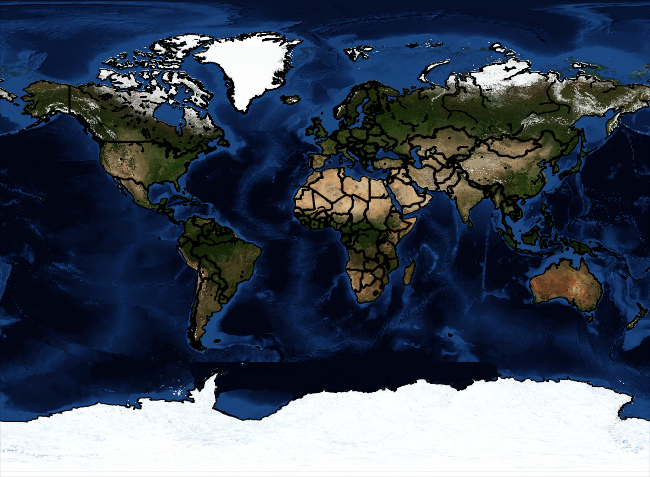
Code up to this point:
from mpl_toolkits.basemap import Basemap
import matplotlib.pyplot as plt

m = Basemap(projection='mill',
            llcrnrlat = -90,
            llcrnrlon = -180,
            urcrnrlat = 90,
            urcrnrlon = 180,
            resolution='l')

m.drawcoastlines()
m.drawcountries(linewidth=2)
##m.drawstates(color='b')
##m.drawcounties(color='darkred')
#m.fillcontinents()
#m.etopo()
m.bluemarble()

plt.title('Basemap Tutorial')
plt.show()
-
Introduction to Matplotlib and basic line
-
Legends, Titles, and Labels with Matplotlib
-
Bar Charts and Histograms with Matplotlib
-
Scatter Plots with Matplotlib
-
Stack Plots with Matplotlib
-
Pie Charts with Matplotlib
-
Loading Data from Files for Matplotlib
-
Data from the Internet for Matplotlib
-
Converting date stamps for Matplotlib
-
Basic customization with Matplotlib
-
Unix Time with Matplotlib
-
Colors and Fills with Matplotlib
-
Spines and Horizontal Lines with Matplotlib
-
Candlestick OHLC graphs with Matplotlib
-
Styles with Matplotlib
-
Live Graphs with Matplotlib
-
Annotations and Text with Matplotlib
-
Annotating Last Price Stock Chart with Matplotlib
-
Subplots with Matplotlib
-
Implementing Subplots to our Chart with Matplotlib
-
More indicator data with Matplotlib
-
Custom fills, pruning, and cleaning with Matplotlib
-
Share X Axis, sharex, with Matplotlib
-
Multi Y Axis with twinx Matplotlib
-
Custom Legends with Matplotlib
-
Basemap Geographic Plotting with Matplotlib
-
Basemap Customization with Matplotlib
-
Plotting Coordinates in Basemap with Matplotlib
-
3D graphs with Matplotlib
-
3D Scatter Plot with Matplotlib
-
3D Bar Chart with Matplotlib
-
Conclusion with Matplotlib
