Subplots with Matplotlib
In this Matplotlib tutorial, we're going to be discussion subplots. There are two major ways to handle for subplots, which are used to create multiple charts on the same figure. For now, we'll start with a clean slate of code. If you're following along linearly, then make sure to keep the old code on hand, or you can always revisit the previous tutorial for the code again.
First, let's create our figure, use a style, create our figure, and then create a function that randomly creates example plots:
import random
import matplotlib.pyplot as plt
from matplotlib import style

style.use('fivethirtyeight')

fig = plt.figure()

def create_plots():
    xs = []
    ys = []

    for i in range(10):
        x = i
        y = random.randrange(10)

        xs.append(x)
        ys.append(y)
    return xs, ys
Now, we're going to start with the add_subplot method of creating subplots:
ax1 = fig.add_subplot(221)
ax2 = fig.add_subplot(222)
ax3 = fig.add_subplot(212)
The way that this works is with 3 numbers, which are: height, width, plot number.
So, a 221 means 2 tall, 2 wide, plot number 1. 222 is 2 tall, 2 wide, and plot number 2. Finally, 212 is a 2 tall, 1 wide, plot number 1.
If you're having trouble visualizing this, see the video, as we also explain this works in paint, which should help if you're confused.
This code gives us the following:
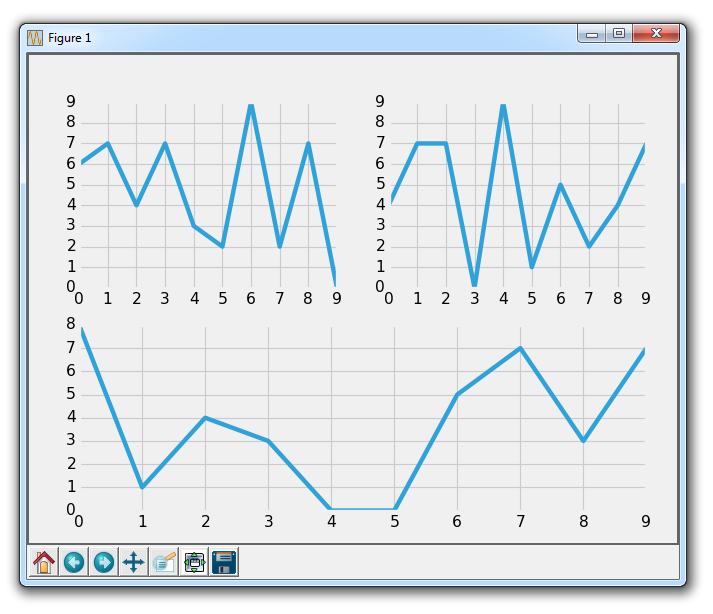
So that is add_subplot. Try to think of some configurations that you think could be interesting, then try to create them with add_subplot until you feel comfortable.
Next, let's cover the other method, which is subplot2grid.
Remove or comment out the other axis definitions, and then add:
ax1 = plt.subplot2grid((6,1), (0,0), rowspan=1, colspan=1)
ax2 = plt.subplot2grid((6,1), (1,0), rowspan=4, colspan=1)
ax3 = plt.subplot2grid((6,1), (5,0), rowspan=1, colspan=1)
So, add_subplot doesn't give us the option to make a plot cover multiple positions. This new, subplot2grid, however, does. So, subplot2grid works by passing first a tuple, which is the grid shape. We do (6,1), which means 6 tall and 1 wide. The next tuple is the starting point of the top left corner. For ax1, this is 0,0, so it will start at the top. Next, we can optionally specify a rowspan and colspan. This is how many rows and columns the axis will span.
This gives us:
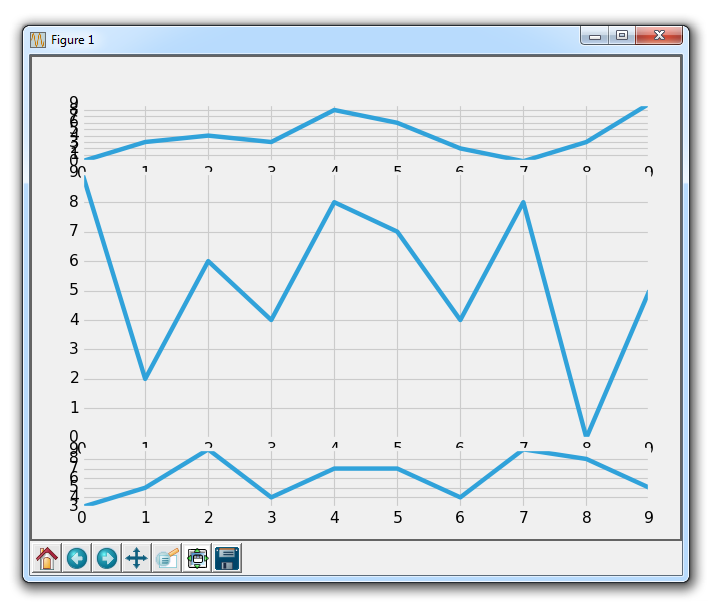
Obviously we have some overlapping issues here, which we can handle with the subplot adjusting.
Again, try envisioning various configurations of subplots and make them happen with subplot2grid until you feel comfortable!
We're going to continue forward using the subplot2grid, applying it to our code that we've been slowly building up to this point, which we'll continue with in the next tutorial.
-
Introduction to Matplotlib and basic line
-
Legends, Titles, and Labels with Matplotlib
-
Bar Charts and Histograms with Matplotlib
-
Scatter Plots with Matplotlib
-
Stack Plots with Matplotlib
-
Pie Charts with Matplotlib
-
Loading Data from Files for Matplotlib
-
Data from the Internet for Matplotlib
-
Converting date stamps for Matplotlib
-
Basic customization with Matplotlib
-
Unix Time with Matplotlib
-
Colors and Fills with Matplotlib
-
Spines and Horizontal Lines with Matplotlib
-
Candlestick OHLC graphs with Matplotlib
-
Styles with Matplotlib
-
Live Graphs with Matplotlib
-
Annotations and Text with Matplotlib
-
Annotating Last Price Stock Chart with Matplotlib
-
Subplots with Matplotlib
-
Implementing Subplots to our Chart with Matplotlib
-
More indicator data with Matplotlib
-
Custom fills, pruning, and cleaning with Matplotlib
-
Share X Axis, sharex, with Matplotlib
-
Multi Y Axis with twinx Matplotlib
-
Custom Legends with Matplotlib
-
Basemap Geographic Plotting with Matplotlib
-
Basemap Customization with Matplotlib
-
Plotting Coordinates in Basemap with Matplotlib
-
3D graphs with Matplotlib
-
3D Scatter Plot with Matplotlib
-
3D Bar Chart with Matplotlib
-
Conclusion with Matplotlib
