3D graphs with Matplotlib
Hello and welcome to a 3D graphing in Matplotlib tutorial. Three dimensional graphing in Matplotlib is already built in, so we do not need to download anything more. First, we need to bring in some integral modules:
from mpl_toolkits.mplot3d import axes3d
import matplotlib.pyplot as plt
The axes3d is used since it takes a different kind of axis in order to actually graph something in three dimensions. Next:
fig = plt.figure()
ax1 = fig.add_subplot(111, projection='3d')
Here, we define the figure as usual, and then we define the ax1 as a typical subplot, just with a 3d projection this time. We need to do this in order to alert Matplotlib that we're about to throw three dimensional data at it.
Now let's create some 3D data:
x = [1,2,3,4,5,6,7,8,9,10]
y = [5,6,7,8,2,5,6,3,7,2]
z = [1,2,6,3,2,7,3,3,7,2]
Next, we plot it. First, let's show a simple wire frame example:
ax1.plot_wireframe(x,y,z)
Finally:
ax1.set_xlabel('x axis')
ax1.set_ylabel('y axis')
ax1.set_zlabel('z axis')

plt.show()
Our full code is:
from mpl_toolkits.mplot3d import axes3d
import matplotlib.pyplot as plt
from matplotlib import style

style.use('fivethirtyeight')

fig = plt.figure()
ax1 = fig.add_subplot(111, projection='3d')

x = [1,2,3,4,5,6,7,8,9,10]
y = [5,6,7,8,2,5,6,3,7,2]
z = [1,2,6,3,2,7,3,3,7,2]

ax1.plot_wireframe(x,y,z)

ax1.set_xlabel('x axis')
ax1.set_ylabel('y axis')
ax1.set_zlabel('z axis')

plt.show()
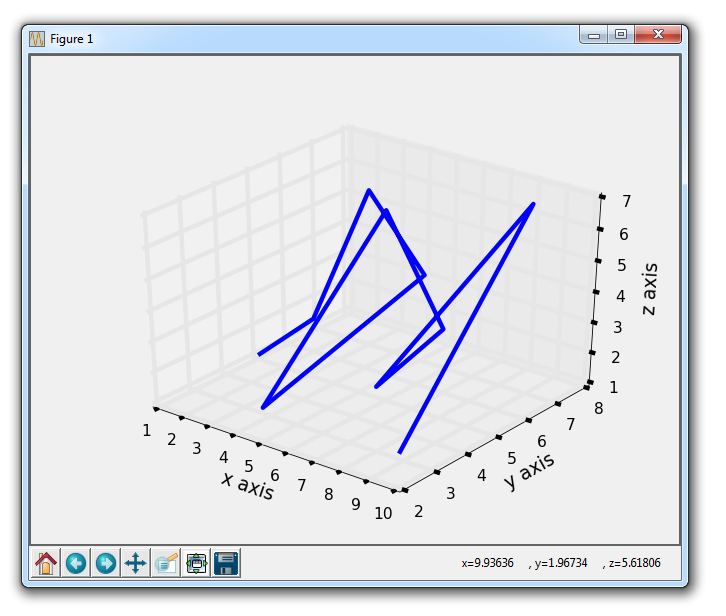
The result here (including adding the use of a style):

These 3D graphs can be interacted with. First, you can use the left mouse click to click and drag in order to move the graph around. You can also use the right mouse button to click and drag in or out to zoom in or out.
-
Introduction to Matplotlib and basic line
-
Legends, Titles, and Labels with Matplotlib
-
Bar Charts and Histograms with Matplotlib
-
Scatter Plots with Matplotlib
-
Stack Plots with Matplotlib
-
Pie Charts with Matplotlib
-
Loading Data from Files for Matplotlib
-
Data from the Internet for Matplotlib
-
Converting date stamps for Matplotlib
-
Basic customization with Matplotlib
-
Unix Time with Matplotlib
-
Colors and Fills with Matplotlib
-
Spines and Horizontal Lines with Matplotlib
-
Candlestick OHLC graphs with Matplotlib
-
Styles with Matplotlib
-
Live Graphs with Matplotlib
-
Annotations and Text with Matplotlib
-
Annotating Last Price Stock Chart with Matplotlib
-
Subplots with Matplotlib
-
Implementing Subplots to our Chart with Matplotlib
-
More indicator data with Matplotlib
-
Custom fills, pruning, and cleaning with Matplotlib
-
Share X Axis, sharex, with Matplotlib
-
Multi Y Axis with twinx Matplotlib
-
Custom Legends with Matplotlib
-
Basemap Geographic Plotting with Matplotlib
-
Basemap Customization with Matplotlib
-
Plotting Coordinates in Basemap with Matplotlib
-
3D graphs with Matplotlib
-
3D Scatter Plot with Matplotlib
-
3D Bar Chart with Matplotlib
-
Conclusion with Matplotlib
