3D Scatter Plot with Matplotlib
Welcome to another 3D Matplotlib tutorial, covering how to graph a 3D scatter plot.
Graphing a 3D scatter plot is very similar to the typical scatter plot as well as the 3D wire_frame.
A quick example:
from mpl_toolkits.mplot3d import axes3d
import matplotlib.pyplot as plt
from matplotlib import style

style.use('ggplot')

fig = plt.figure()
ax1 = fig.add_subplot(111, projection='3d')

x = [1,2,3,4,5,6,7,8,9,10]
y = [5,6,7,8,2,5,6,3,7,2]
z = [1,2,6,3,2,7,3,3,7,2]

x2 = [-1,-2,-3,-4,-5,-6,-7,-8,-9,-10]
y2 = [-5,-6,-7,-8,-2,-5,-6,-3,-7,-2]
z2 = [1,2,6,3,2,7,3,3,7,2]

ax1.scatter(x, y, z, c='g', marker='o')
ax1.scatter(x2, y2, z2, c ='r', marker='o')

ax1.set_xlabel('x axis')
ax1.set_ylabel('y axis')
ax1.set_zlabel('z axis')

plt.show()
The result here:
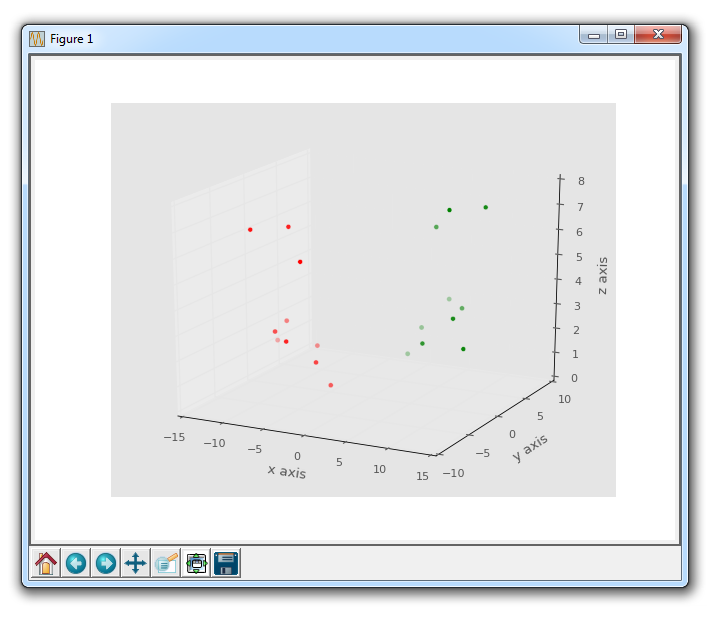
Note here that you can change the size and marker with these plots, just like you can with a typical scatter plot.
-
Introduction to Matplotlib and basic line
-
Legends, Titles, and Labels with Matplotlib
-
Bar Charts and Histograms with Matplotlib
-
Scatter Plots with Matplotlib
-
Stack Plots with Matplotlib
-
Pie Charts with Matplotlib
-
Loading Data from Files for Matplotlib
-
Data from the Internet for Matplotlib
-
Converting date stamps for Matplotlib
-
Basic customization with Matplotlib
-
Unix Time with Matplotlib
-
Colors and Fills with Matplotlib
-
Spines and Horizontal Lines with Matplotlib
-
Candlestick OHLC graphs with Matplotlib
-
Styles with Matplotlib
-
Live Graphs with Matplotlib
-
Annotations and Text with Matplotlib
-
Annotating Last Price Stock Chart with Matplotlib
-
Subplots with Matplotlib
-
Implementing Subplots to our Chart with Matplotlib
-
More indicator data with Matplotlib
-
Custom fills, pruning, and cleaning with Matplotlib
-
Share X Axis, sharex, with Matplotlib
-
Multi Y Axis with twinx Matplotlib
-
Custom Legends with Matplotlib
-
Basemap Geographic Plotting with Matplotlib
-
Basemap Customization with Matplotlib
-
Plotting Coordinates in Basemap with Matplotlib
-
3D graphs with Matplotlib
-
3D Scatter Plot with Matplotlib
-
3D Bar Chart with Matplotlib
-
Conclusion with Matplotlib
