Loading Data from Files for Matplotlib
Many times, people want to graph data from a file. There are many types of files, and many ways you may extract data from a file to graph it. Here, we'll show a couple of ways one might do this. First, we'll use the built-in csv module to load CSV files, then we'll show how to utilize NumPy, which is a third-party module, to load files.
import matplotlib.pyplot as plt
import csv

x = []
y = []

with open('example.txt','r') as csvfile:
    plots = csv.reader(csvfile, delimiter=',')
    for row in plots:
        x.append(int(row[0]))
        y.append(int(row[1]))

plt.plot(x,y, label='Loaded from file!')
plt.xlabel('x')
plt.ylabel('y')
plt.title('Interesting Graph\nCheck it out')
plt.legend()
plt.show()

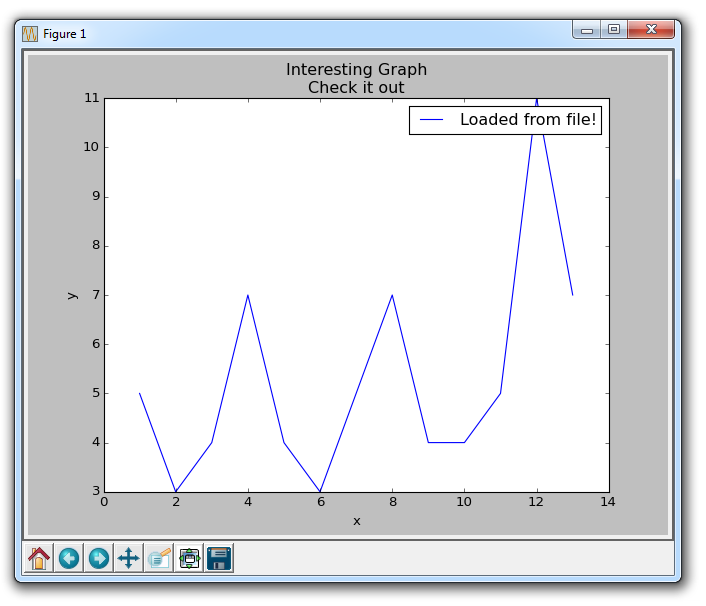
Here, we open a sample file, which contains the following data:
1,5
2,3
3,4
4,7
5,4
6,3
7,5
8,7
9,4
10,4
Next, we use the csv module to read in the data. The csv reader automatically splits the file by line, and then the data in the file by the delimiter we choose. In our case, this is a comma. Note: the "csv" module and the csv reader does not require the file to be literally a .csv file. It can be any text file that simply has delimited data.
Once we've done this, we store the elements with an index of 0 to the x list and the elements with an index of 1 to the y list. After this, we're all set and ready to plot, then show the data.
While using the CSV module is completely fine, using the NumPy module to load our files and data is likely to make more sense for us down the line. If you do not have NumPy, you will need to get it to follow along there. To learn more about installing modules, see the pip tutorial. Most people should be able to just open the command line, and do pip install numpy
If not, see the linked tutorial.
Once you have NumPy, you can write code like:
import matplotlib.pyplot as plt
import numpy as np

x, y = np.loadtxt('example.txt', delimiter=',', unpack=True)
plt.plot(x,y, label='Loaded from file!')

plt.xlabel('x')
plt.ylabel('y')
plt.title('Interesting Graph\nCheck it out')
plt.legend()
plt.show()
The result should be the same graph. Later on, we can utilize NumPy to do some more work for us when we load the data in, but that is content for a future tutorial! Just like with the csv module not needing a .csv specifically, the loadtxt function does not require the file to be a .txt file, it could be a .csv, and it can even be a python list object!
-
Introduction to Matplotlib and basic line
-
Legends, Titles, and Labels with Matplotlib
-
Bar Charts and Histograms with Matplotlib
-
Scatter Plots with Matplotlib
-
Stack Plots with Matplotlib
-
Pie Charts with Matplotlib
-
Loading Data from Files for Matplotlib
-
Data from the Internet for Matplotlib
-
Converting date stamps for Matplotlib
-
Basic customization with Matplotlib
-
Unix Time with Matplotlib
-
Colors and Fills with Matplotlib
-
Spines and Horizontal Lines with Matplotlib
-
Candlestick OHLC graphs with Matplotlib
-
Styles with Matplotlib
-
Live Graphs with Matplotlib
-
Annotations and Text with Matplotlib
-
Annotating Last Price Stock Chart with Matplotlib
-
Subplots with Matplotlib
-
Implementing Subplots to our Chart with Matplotlib
-
More indicator data with Matplotlib
-
Custom fills, pruning, and cleaning with Matplotlib
-
Share X Axis, sharex, with Matplotlib
-
Multi Y Axis with twinx Matplotlib
-
Custom Legends with Matplotlib
-
Basemap Geographic Plotting with Matplotlib
-
Basemap Customization with Matplotlib
-
Plotting Coordinates in Basemap with Matplotlib
-
3D graphs with Matplotlib
-
3D Scatter Plot with Matplotlib
-
3D Bar Chart with Matplotlib
-
Conclusion with Matplotlib
