Converting date stamps for Matplotlib
This tutorial is focused around converting the datestamps from the Yahoo finance API to times that Matplotlib understands. To do this, we're going to write a new function, bytespdate2num.
def bytespdate2num(fmt, encoding='utf-8'):
    strconverter = mdates.strpdate2num(fmt)
    def bytesconverter(b):
        s = b.decode(encoding)
        return strconverter(s)
    return bytesconverter
This function takes the data, decodes the data based on the encoding, then it returns that.
Applying this to the rest of our program:
import matplotlib.pyplot as plt
import numpy as np
import urllib
import matplotlib.dates as mdates
def bytespdate2num(fmt, encoding='utf-8'):
strconverter = mdates.strpdate2num(fmt)
def bytesconverter(b):
s = b.decode(encoding)
return strconverter(s)
return bytesconverter
def graph_data(stock):
# Unfortunately, Yahoo's API is no longer available
# feel free to adapt the code to another source, or use this drop-in replacement.
stock_price_url = 'https://pythonprogramming.net/yahoo_finance_replacement'
source_code = urllib.request.urlopen(stock_price_url).read().decode()
stock_data = []
split_source = source_code.split('\n')
for line in split_source[1:]:
split_line = line.split(',')
if len(split_line) == 7:
if 'values' not in line and 'labels' not in line:
stock_data.append(line)
date, closep, highp, lowp, openp, adj_closep, volume = np.loadtxt(stock_data,
delimiter=',',
unpack=True,
# %Y = full year. 2015
# %y = partial year 15
# %m = number month
# %d = number day
# %H = hours
# %M = minutes
# %S = seconds
# 12-06-2014
# %m-%d-%Y
converters={0: bytespdate2num('%Y-%m-%d')})
plt.plot_date(date, closep,'-', label='Price')
plt.xlabel('Date')
plt.ylabel('Price')
plt.title('Interesting Graph\nCheck it out')
plt.legend()
plt.show()
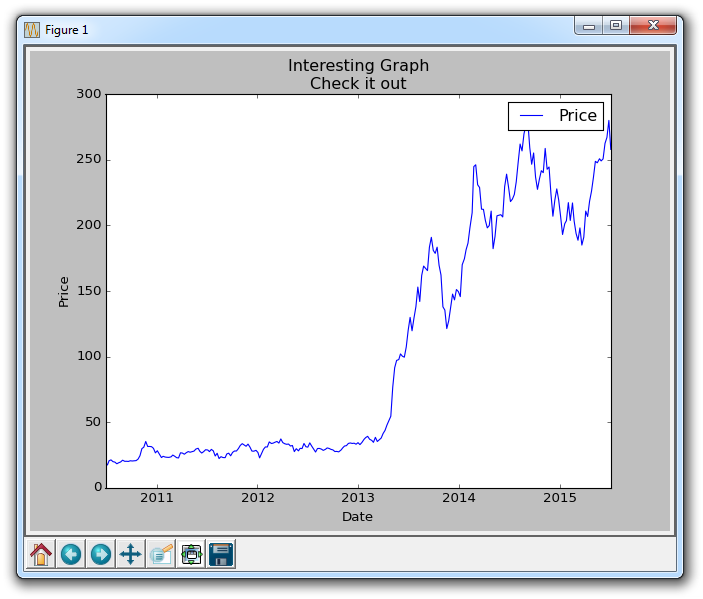
graph_data('TSLA')
The resulting graph should look something like this, if you're plotting TSLA:
There exists 1 quiz/question(s) for this tutorial. for access to these, video downloads, and no ads.
-
Introduction to Matplotlib and basic line
-
Legends, Titles, and Labels with Matplotlib
-
Bar Charts and Histograms with Matplotlib
-
Scatter Plots with Matplotlib
-
Stack Plots with Matplotlib
-
Pie Charts with Matplotlib
-
Loading Data from Files for Matplotlib
-
Data from the Internet for Matplotlib
-
Converting date stamps for Matplotlib
-
Basic customization with Matplotlib
-
Unix Time with Matplotlib
-
Colors and Fills with Matplotlib
-
Spines and Horizontal Lines with Matplotlib
-
Candlestick OHLC graphs with Matplotlib
-
Styles with Matplotlib
-
Live Graphs with Matplotlib
-
Annotations and Text with Matplotlib
-
Annotating Last Price Stock Chart with Matplotlib
-
Subplots with Matplotlib
-
Implementing Subplots to our Chart with Matplotlib
-
More indicator data with Matplotlib
-
Custom fills, pruning, and cleaning with Matplotlib
-
Share X Axis, sharex, with Matplotlib
-
Multi Y Axis with twinx Matplotlib
-
Custom Legends with Matplotlib
-
Basemap Geographic Plotting with Matplotlib
-
Basemap Customization with Matplotlib
-
Plotting Coordinates in Basemap with Matplotlib
-
3D graphs with Matplotlib
-
3D Scatter Plot with Matplotlib
-
3D Bar Chart with Matplotlib
-
Conclusion with Matplotlib
