How to embed a Matplotlib graph to your Tkinter GUI
Since we are creating a bitcoin trading application, it only makes sense that we're going to have to incorporate some price data. Not only do we want to just plot the prices, but many people will want to see prices in the form of OHLC candlesticks, and then others will also want to see various indicators like EMA/SMA crossovers and things like RSI or MACD.
To do this, we first need to know how to actually embed a Matplotlib graph into a Tkinter application. Here's how!
First, we're going to be using Matplotlib, so, if you do not have it, you will need to get it. There are many ways to get Matplotlib, head over to Matplotlib.org to download.
You can also use pip to install using: pip install matplotlib in cmd.exe / bash.
If you need help with pip, check out the .
Now we're going to need to add the following imports to our Tkinter application:
import matplotlib
matplotlib.use("TkAgg")
from matplotlib.backends.backend_tkagg import FigureCanvasTkAgg, NavigationToolbar2TkAgg
from matplotlib.figure import Figure
The first just imports the Matplotlib module. Next, we specifiy the backend, "TkAgg" that we wish to use with Matplotlib. Normally, using the default is perfectly fine, but we need to change this for our uses here.
Next, we import the FigureCanvasTkAgg as well as the navigation bar that is used with Matplotlib.
Finally, we import Figure. We will just be temporarily using this Figure, but that's okay.
Now let's go ahead and add a new page. This will be our "graph" page.
class PageThree(tk.Frame):

    def __init__(self, parent, controller):
        tk.Frame.__init__(self, parent)
        label = tk.Label(self, text="Graph Page!", font=LARGE_FONT)
        label.pack(pady=10,padx=10)

        button1 = ttk.Button(self, text="Back to Home",
                            command=lambda: controller.show_frame(StartPage))
        button1.pack()
Typical stuff here, with a navigation back to head back to the main page.
        f = Figure(figsize=(5,5), dpi=100)
        a = f.add_subplot(111)
        a.plot([1,2,3,4,5,6,7,8],[5,6,1,3,8,9,3,5])


        canvas = FigureCanvasTkAgg(f, self)
        canvas.show()
        canvas.get_tk_widget().pack(side=tk.BOTTOM, fill=tk.BOTH, expand=True)

        toolbar = NavigationToolbar2TkAgg(canvas, self)
        toolbar.update()
        canvas._tkcanvas.pack(side=tk.TOP, fill=tk.BOTH, expand=True)
Here's where our embedding code begins.
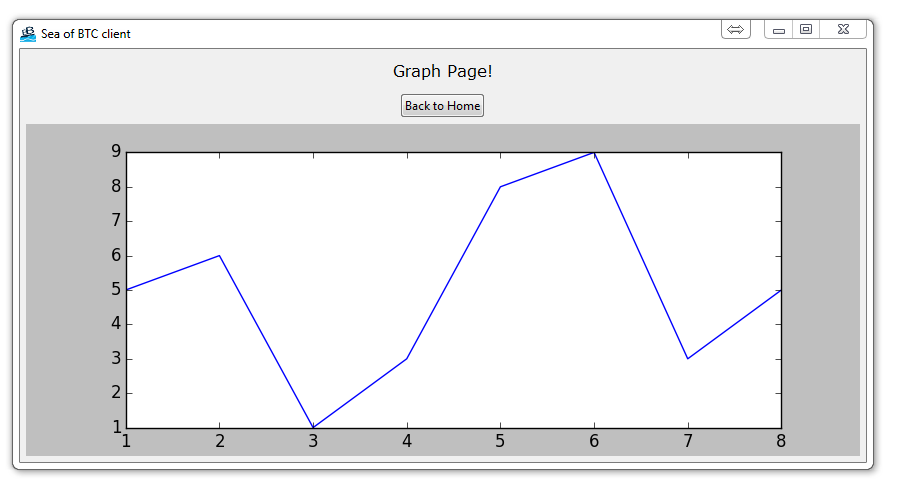
First we are defining our figure, then adding a subplot. From there, we plot as usual some x coordinates and some y.
Next, we add the canvas, which is what we intend to render the graph to.
Finally, we add the toolbar, which is the traditional matplotlib tool bar.
From there, we then pack all of this to our tkinter window.
That's all there is to it, really! Your result should be a window and if you click page 3:

If you fell behind or need the whole code for whatever reason up to this point:
# The code for changing pages was derived from: http://stackoverflow.com/questions/7546050/switch-between-two-frames-in-tkinter
# License: http://creativecommons.org/licenses/by-sa/3.0/

import matplotlib
matplotlib.use("TkAgg")
from matplotlib.backends.backend_tkagg import FigureCanvasTkAgg, NavigationToolbar2TkAgg
from matplotlib.figure import Figure

import tkinter as tk
from tkinter import ttk


LARGE_FONT= ("Verdana", 12)


class SeaofBTCapp(tk.Tk):

    def __init__(self, *args, **kwargs):

        tk.Tk.__init__(self, *args, **kwargs)

        tk.Tk.iconbitmap(self, default="clienticon.ico")
        tk.Tk.wm_title(self, "Sea of BTC client")


        container = tk.Frame(self)
        container.pack(side="top", fill="both", expand = True)
        container.grid_rowconfigure(0, weight=1)
        container.grid_columnconfigure(0, weight=1)

        self.frames = {}

        for F in (StartPage, PageOne, PageTwo, PageThree):

            frame = F(container, self)

            self.frames[F] = frame

            frame.grid(row=0, column=0, sticky="nsew")

        self.show_frame(StartPage)

    def show_frame(self, cont):

        frame = self.frames[cont]
        frame.tkraise()


class StartPage(tk.Frame):

    def __init__(self, parent, controller):
        tk.Frame.__init__(self,parent)
        label = tk.Label(self, text="Start Page", font=LARGE_FONT)
        label.pack(pady=10,padx=10)

        button = ttk.Button(self, text="Visit Page 1",
                            command=lambda: controller.show_frame(PageOne))
        button.pack()

        button2 = ttk.Button(self, text="Visit Page 2",
                            command=lambda: controller.show_frame(PageTwo))
        button2.pack()

        button3 = ttk.Button(self, text="Graph Page",
                            command=lambda: controller.show_frame(PageThree))
        button3.pack()


class PageOne(tk.Frame):

    def __init__(self, parent, controller):
        tk.Frame.__init__(self, parent)
        label = tk.Label(self, text="Page One!!!", font=LARGE_FONT)
        label.pack(pady=10,padx=10)

        button1 = ttk.Button(self, text="Back to Home",
                            command=lambda: controller.show_frame(StartPage))
        button1.pack()

        button2 = ttk.Button(self, text="Page Two",
                            command=lambda: controller.show_frame(PageTwo))
        button2.pack()


class PageTwo(tk.Frame):

    def __init__(self, parent, controller):
        tk.Frame.__init__(self, parent)
        label = tk.Label(self, text="Page Two!!!", font=LARGE_FONT)
        label.pack(pady=10,padx=10)

        button1 = ttk.Button(self, text="Back to Home",
                            command=lambda: controller.show_frame(StartPage))
        button1.pack()

        button2 = ttk.Button(self, text="Page One",
                            command=lambda: controller.show_frame(PageOne))
        button2.pack()


class PageThree(tk.Frame):

    def __init__(self, parent, controller):
        tk.Frame.__init__(self, parent)
        label = tk.Label(self, text="Graph Page!", font=LARGE_FONT)
        label.pack(pady=10,padx=10)

        button1 = ttk.Button(self, text="Back to Home",
                            command=lambda: controller.show_frame(StartPage))
        button1.pack()

        f = Figure(figsize=(5,5), dpi=100)
        a = f.add_subplot(111)
        a.plot([1,2,3,4,5,6,7,8],[5,6,1,3,8,9,3,5])


        canvas = FigureCanvasTkAgg(f, self)
        canvas.show()
        canvas.get_tk_widget().pack(side=tk.BOTTOM, fill=tk.BOTH, expand=True)

        toolbar = NavigationToolbar2TkAgg(canvas, self)
        toolbar.update()
        canvas._tkcanvas.pack(side=tk.TOP, fill=tk.BOTH, expand=True)


app = SeaofBTCapp()
app.mainloop()
-
Programming GUIs and windows with Tkinter and Python Introduction
-
Object Oriented Programming Crash Course with Tkinter
-
Passing functions with Parameters in Tkinter using Lambda
-
How to change and show a new window in Tkinter
-
Styling your GUI a bit using TTK
-
How to embed a Matplotlib graph to your Tkinter GUI
-
How to make the Matplotlib graph live in your application
-
Organizing our GUI
-
Plotting Live Updating Data in Matplotlib and our Tkinter GUI
-
Customizing an embedded Matplotlib Graph in Tkinter
-
Creating our Main Menu in Tkinter
-
Building a pop-up message window
-
Exchange Choice Option
-
Time-frame and sample size option
-
Adding indicator Menus (3 videos)
-
Trading option, start/stop, and help menu options
-
Tutorial on adding a tutorial
-
Allowing the exchange choice option to affect actual shown exchange
-
Adding exchange choice cont'd
-
Adding exchange choices part 3
-
Indicator Support
-
Pulling data from the Sea of BTC API
-
Setting up sub plots within our Tkinter GUI
-
Graphing an OHLC candlestick graph embedded in our Tkinter GUI
-
Acquiring RSI data from Sea of BTC API
-
Acquiring MACD data from Sea of BTC API
-
Converting Tkinter application to .exe and installer with cx_Freeze
