Adding indicator Menus (3 videos)
In this Tkinter tutorial, we're going to be adding the indicator menu options. Our goal is to allow the user to choose a "top" indicator, "middle" indicator, and "bottom" indicator. First we need to allow them to set the parameters for these, then we'll build the actual handling that will control the sub plots, data, and all of that. Let's get started!
This section of the tutorial is going to cover the next three videos. If you're following along using the videos, keep that in mind!
That said, if you're comfortable with adding options by now, the actual amount of new content is relatively small.
First we need to add the new menu options, so just add the following under the OHLC interval options:
        topIndi = tk.Menu(menubar, tearoff=1)
        topIndi.add_command(label="None",
                                  command=lambda: addTopIndicator('none'))
        topIndi.add_separator()
        topIndi.add_command ( label="RSI",
                                  command=lambda: addTopIndicator('rsi'))
        topIndi.add_command ( label="MACD",
                                  command=lambda: addTopIndicator('macd'))
        menubar.add_cascade(label = "Top Indicator", menu = topIndi)


        mainI = tk.Menu(menubar, tearoff=1)
        mainI.add_command ( label="None",
                                  command=lambda: addMiddleIndicator('none'))
        mainI.add_separator()
        mainI.add_command ( label="SMA",
                                  command=lambda: addMiddleIndicator('sma'))
        mainI.add_command ( label="EMA",
                                  command=lambda: addMiddleIndicator('ema'))
        menubar.add_cascade(label = "Main Graph Indicator", menu = mainI)


        bottomI = tk.Menu(menubar, tearoff=1)
        bottomI.add_command ( label="None",
                                  command=lambda: addBottomIndicator('none'))
        bottomI.add_separator()
        bottomI.add_command ( label="RSI",
                                  command=lambda: addBottomIndicator('rsi'))
        bottomI.add_command ( label="MACD",
                                  command=lambda: addBottomIndicator('macd'))
        menubar.add_cascade(label = "Bottom Indicator", menu = bottomI)
Now, at the top, define the following new global variables:
topIndicator = "none"
bottomIndicator = "none"
middleIndicators = "none"
EMAs = []
SMAs = []
Next, we're going to add the indicator functions to the top of our script after the main global vars:
def addMiddleIndicator(what):
    global middleIndicator
    global DatCounter

    if DataPace == "tick":
        popupmsg("Indicators in Tick Data not available.")

    if what != "none":
        if middleIndicator == "none":
            if what == "sma":
                midIQ = tk.Tk()
                midIQ.wm_title("Periods?")
                label = ttk.Label(midIQ, text="Choose how many periods you want your SMA to be.")
                label.pack(side="top", fill="x", pady=10)
                e = ttk.Entry(midIQ)
                e.insert(0,10)
                e.pack()
                e.focus_set()

                def callback():
                    global middleIndicator
                    global DatCounter

                    middleIndicator = []
                    periods = (e.get())
                    group = []
                    group.append("sma")
                    group.append(int(periods))
                    middleIndicator.append(group)
                    DatCounter = 9000
                    print("middle indicator set to:",middleIndicator)
                    midIQ.destroy()

                b = ttk.Button(midIQ, text="Submit", width=10, command=callback)
                b.pack()
                tk.mainloop()

            if what == "ema":
                midIQ = tk.Tk()
                #midIQ.wm_title("Periods?")
                label = ttk.Label(midIQ, text="Choose how many periods you want your EMA to be.")
                label.pack(side="top", fill="x", pady=10)
                e = ttk.Entry(midIQ)
                e.insert(0,10)
                e.pack()
                e.focus_set()

                def callback():
                    global middleIndicator
                    global DatCounter

                    middleIndicator = []
                    periods = (e.get())
                    group = []
                    group.append("ema")
                    group.append(int(periods))
                    middleIndicator.append(group)
                    DatCounter = 9000
                    print("middle indicator set to:",middleIndicator)
                    midIQ.destroy()

                b = ttk.Button(midIQ, text="Submit", width=10, command=callback)
                b.pack()
                tk.mainloop()

        else:
            if what == "sma":
                midIQ = tk.Tk()
                midIQ.wm_title("Periods?")
                label = ttk.Label(midIQ, text="Choose how many periods you want your SMA to be.")
                label.pack(side="top", fill="x", pady=10)
                e = ttk.Entry(midIQ)
                e.insert(0,10)
                e.pack()
                e.focus_set()

                def callback():
                    global middleIndicator
                    global DatCounter

                    #middleIndicator = []
                    periods = (e.get())
                    group = []
                    group.append("sma")
                    group.append(int(periods))
                    middleIndicator.append(group)
                    DatCounter = 9000
                    print("middle indicator set to:",middleIndicator)
                    midIQ.destroy()

                b = ttk.Button(midIQ, text="Submit", width=10, command=callback)
                b.pack()
                tk.mainloop()


            if what == "ema":
                midIQ = tk.Tk()
                midIQ.wm_title("Periods?")
                label = ttk.Label(midIQ, text="Choose how many periods you want your EMA to be.")
                label.pack(side="top", fill="x", pady=10)
                e = ttk.Entry(midIQ)
                e.insert(0,10)
                e.pack()
                e.focus_set()

                def callback():
                    global middleIndicator
                    global DatCounter

                    #middleIndicator = []
                    periods = (e.get())
                    group = []
                    group.append("ema")
                    group.append(int(periods))
                    middleIndicator.append(group)
                    DatCounter = 9000
                    print("middle indicator set to:",middleIndicator)
                    midIQ.destroy()

                b = ttk.Button(midIQ, text="Submit", width=10, command=callback)
                b.pack()
                tk.mainloop()

    else:
        middleIndicator = "none"


def addTopIndicator(what):
    global topIndicator
    global DatCounter

    if DataPace == "tick":
        popupmsg("Indicators in Tick Data not available.")

    elif what == "none":
        topIndicator = what
        DatCounter = 9000

    elif what == "rsi":
        rsiQ = tk.Tk()
        rsiQ.wm_title("Periods?")
        label = ttk.Label(rsiQ, text = "Choose how many periods you want each RSI calculation to consider.")
        label.pack(side="top", fill="x", pady=10)

        e = ttk.Entry(rsiQ)
        e.insert(0,14)
        e.pack()
        e.focus_set()

        def callback():
            global topIndicator
            global DatCounter

            periods = (e.get())
            group = []
            group.append("rsi")
            group.append(periods)

            topIndicator = group
            DatCounter = 9000
            print("Set top indicator to",group)
            rsiQ.destroy()

        b = ttk.Button(rsiQ, text="Submit", width=10, command=callback)
        b.pack()
        tk.mainloop()


    elif what == "macd":
        global topIndicator
        global DatCounter
        topIndicator = "macd"
        DatCounter = 9000


def addBottomIndicator(what):
    global bottomIndicator
    global DatCounter

    if DataPace == "tick":
        popupmsg("Indicators in Tick Data not available.")

    elif what == "none":
        bottomIndicator = what
        DatCounter = 9000

    elif what == "rsi":
        rsiQ = tk.Tk()
        rsiQ.wm_title("Periods?")
        label = ttk.Label(rsiQ, text = "Choose how many periods you want each RSI calculation to consider.")
        label.pack(side="top", fill="x", pady=10)

        e = ttk.Entry(rsiQ)
        e.insert(0,14)
        e.pack()
        e.focus_set()

        def callback():
            global bottomIndicator
            global DatCounter

            periods = (e.get())
            group = []
            group.append("rsi")
            group.append(periods)

            bottomIndicator = group
            DatCounter = 9000
            print("Set bottom indicator to",group)
            rsiQ.destroy()

        b = ttk.Button(rsiQ, text="Submit", width=10, command=callback)
        b.pack()
        tk.mainloop()


    elif what == "macd":
        global bottomIndicator
        global DatCounter
        bottomIndicator = "macd"
        DatCounter = 9000
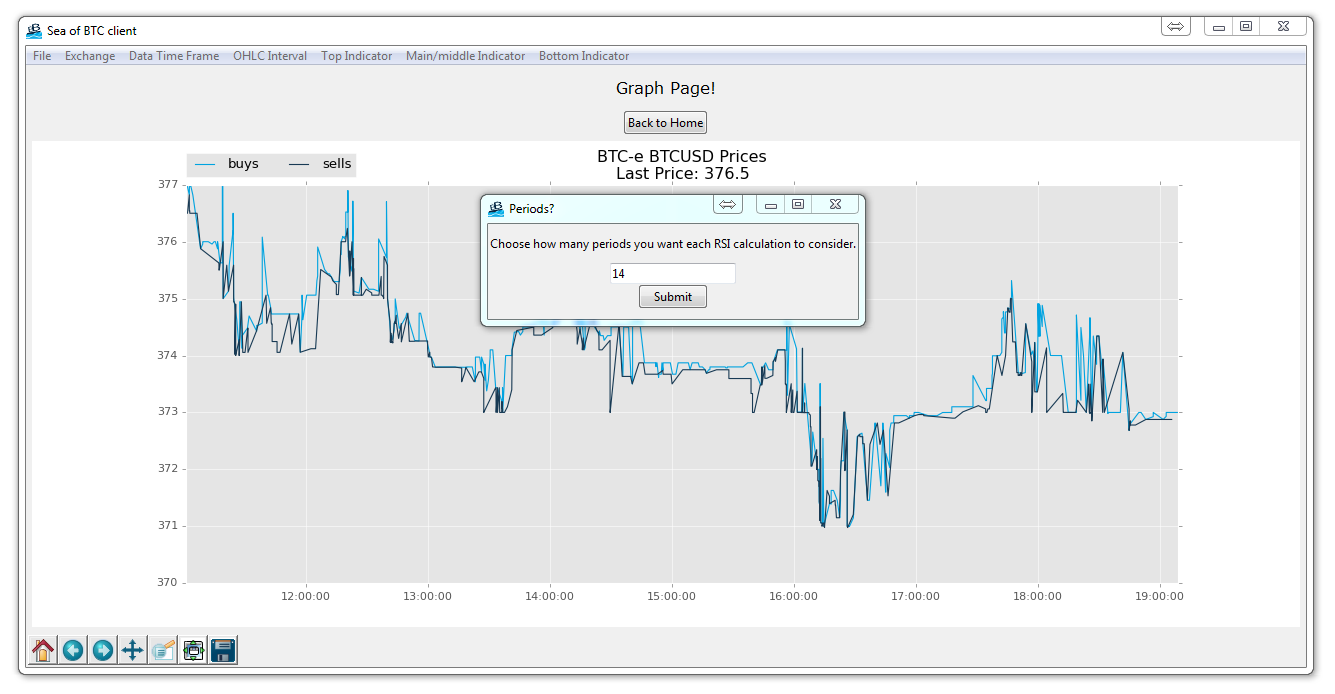
So now we've got the functions for our indicators. For something like MACD (moving average convergence divergence), we aren't going to let the user change the time frames. For EMA, SMA, and RSI, we want to allow the user to choose parameters, so those will come with a popup window that allows the user to then fill in the blank for the number of their choice for time-frame windows.
The current result should be something like this if you click on the RSI indicator option:
# The code for changing pages was derived from: http://stackoverflow.com/questions/7546050/switch-between-two-frames-in-tkinter
# License: http://creativecommons.org/licenses/by-sa/3.0/
import matplotlib
matplotlib.use("TkAgg")
from matplotlib.backends.backend_tkagg import FigureCanvasTkAgg, NavigationToolbar2TkAgg
from matplotlib.figure import Figure
import matplotlib.animation as animation
from matplotlib import style

import tkinter as tk
from tkinter import ttk

import urllib
import json

import pandas as pd
import numpy as np

from matplotlib import pyplot as plt


LARGE_FONT= ("Verdana", 12)
NORM_FONT= ("Verdana", 10)
SMALL_FONT= ("Verdana", 8)


style.use("ggplot")

f = Figure()
a = f.add_subplot(111)

exchange = "BTC-e"
DatCounter = 9000
programName = "btce"
resampleSize = "15Min"
DataPace = "1d"
candleWidth = 0.008

topIndicator = "none"
bottomIndicator = "none"
middleIndicator = "none"
EMAs = []
SMAs = []


def addMiddleIndicator(what):
    global middleIndicator
    global DatCounter

    if DataPace == "tick":
        popupmsg("Indicators in Tick Data not available.")

    if what != "none":
        if middleIndicator == "none":
            if what == "sma":
                midIQ = tk.Tk()
                midIQ.wm_title("Periods?")
                label = ttk.Label(midIQ, text="Choose how many periods you want your SMA to be.")
                label.pack(side="top", fill="x", pady=10)
                e = ttk.Entry(midIQ)
                e.insert(0,10)
                e.pack()
                e.focus_set()

                def callback():
                    global middleIndicator
                    global DatCounter

                    middleIndicator = []
                    periods = (e.get())
                    group = []
                    group.append("sma")
                    group.append(int(periods))
                    middleIndicator.append(group)
                    DatCounter = 9000
                    print("middle indicator set to:",middleIndicator)
                    midIQ.destroy()

                b = ttk.Button(midIQ, text="Submit", width=10, command=callback)
                b.pack()
                tk.mainloop()

            if what == "ema":
                midIQ = tk.Tk()
                #midIQ.wm_title("Periods?")
                label = ttk.Label(midIQ, text="Choose how many periods you want your EMA to be.")
                label.pack(side="top", fill="x", pady=10)
                e = ttk.Entry(midIQ)
                e.insert(0,10)
                e.pack()
                e.focus_set()

                def callback():
                    global middleIndicator
                    global DatCounter

                    middleIndicator = []
                    periods = (e.get())
                    group = []
                    group.append("ema")
                    group.append(int(periods))
                    middleIndicator.append(group)
                    DatCounter = 9000
                    print("middle indicator set to:",middleIndicator)
                    midIQ.destroy()

                b = ttk.Button(midIQ, text="Submit", width=10, command=callback)
                b.pack()
                tk.mainloop()

        else:
            if what == "sma":
                midIQ = tk.Tk()
                midIQ.wm_title("Periods?")
                label = ttk.Label(midIQ, text="Choose how many periods you want your SMA to be.")
                label.pack(side="top", fill="x", pady=10)
                e = ttk.Entry(midIQ)
                e.insert(0,10)
                e.pack()
                e.focus_set()

                def callback():
                    global middleIndicator
                    global DatCounter

                    #middleIndicator = []
                    periods = (e.get())
                    group = []
                    group.append("sma")
                    group.append(int(periods))
                    middleIndicator.append(group)
                    DatCounter = 9000
                    print("middle indicator set to:",middleIndicator)
                    midIQ.destroy()

                b = ttk.Button(midIQ, text="Submit", width=10, command=callback)
                b.pack()
                tk.mainloop()


            if what == "ema":
                midIQ = tk.Tk()
                midIQ.wm_title("Periods?")
                label = ttk.Label(midIQ, text="Choose how many periods you want your EMA to be.")
                label.pack(side="top", fill="x", pady=10)
                e = ttk.Entry(midIQ)
                e.insert(0,10)
                e.pack()
                e.focus_set()

                def callback():
                    global middleIndicator
                    global DatCounter

                    #middleIndicator = []
                    periods = (e.get())
                    group = []
                    group.append("ema")
                    group.append(int(periods))
                    middleIndicator.append(group)
                    DatCounter = 9000
                    print("middle indicator set to:",middleIndicator)
                    midIQ.destroy()

                b = ttk.Button(midIQ, text="Submit", width=10, command=callback)
                b.pack()
                tk.mainloop()

    else:
        middleIndicator = "none"


def addTopIndicator(what):
    global topIndicator
    global DatCounter

    if DataPace == "tick":
        popupmsg("Indicators in Tick Data not available.")

    elif what == "none":
        topIndicator = what
        DatCounter = 9000

    elif what == "rsi":
        rsiQ = tk.Tk()
        rsiQ.wm_title("Periods?")
        label = ttk.Label(rsiQ, text = "Choose how many periods you want each RSI calculation to consider.")
        label.pack(side="top", fill="x", pady=10)

        e = ttk.Entry(rsiQ)
        e.insert(0,14)
        e.pack()
        e.focus_set()

        def callback():
            global topIndicator
            global DatCounter

            periods = (e.get())
            group = []
            group.append("rsi")
            group.append(periods)

            topIndicator = group
            DatCounter = 9000
            print("Set top indicator to",group)
            rsiQ.destroy()

        b = ttk.Button(rsiQ, text="Submit", width=10, command=callback)
        b.pack()
        tk.mainloop()


    elif what == "macd":
        global topIndicator
        global DatCounter
        topIndicator = "macd"
        DatCounter = 9000


def addBottomIndicator(what):
    global bottomIndicator
    global DatCounter

    if DataPace == "tick":
        popupmsg("Indicators in Tick Data not available.")

    elif what == "none":
        bottomIndicator = what
        DatCounter = 9000

    elif what == "rsi":
        rsiQ = tk.Tk()
        rsiQ.wm_title("Periods?")
        label = ttk.Label(rsiQ, text = "Choose how many periods you want each RSI calculation to consider.")
        label.pack(side="top", fill="x", pady=10)

        e = ttk.Entry(rsiQ)
        e.insert(0,14)
        e.pack()
        e.focus_set()

        def callback():
            global bottomIndicator
            global DatCounter

            periods = (e.get())
            group = []
            group.append("rsi")
            group.append(periods)

            bottomIndicator = group
            DatCounter = 9000
            print("Set bottom indicator to",group)
            rsiQ.destroy()

        b = ttk.Button(rsiQ, text="Submit", width=10, command=callback)
        b.pack()
        tk.mainloop()


    elif what == "macd":
        global bottomIndicator
        global DatCounter
        bottomIndicator = "macd"
        DatCounter = 9000


def changeTimeFrame(tf):
    global DataPace
    global DatCounter
    if tf == "7d" and resampleSize == "1Min":
        popupmsg("Too much data chosen, choose a smaller time frame or higher OHLC interval")
    else:
        DataPace = tf
        DatCounter = 9000


def changeSampleSize(size,width):
    global resampleSize
    global DatCounter
    global candleWidth
    if DataPace == "7d" and resampleSize == "1Min":
        popupmsg("Too much data chosen, choose a smaller time frame or higher OHLC interval")

    elif DataPace == "tick":
        popupmsg("You're currently viewing tick data, not OHLC.")

    else:
        resampleSize = size
        DatCounter = 9000
        candleWidth = width


def changeExchange(toWhat,pn):
    global exchange
    global DatCounter
    global programName

    exchange = toWhat
    programName = pn
    DatCounter = 9000


def popupmsg(msg):
    popup = tk.Tk()
    popup.wm_title("!")
    label = ttk.Label(popup, text=msg, font=NORM_FONT)
    label.pack(side="top", fill="x", pady=10)
    B1 = ttk.Button(popup, text="Okay", command = popup.destroy)
    B1.pack()
    popup.mainloop()


def animate(i):
    dataLink = 'https://btc-e.com/api/3/trades/btc_usd?limit=2000'
    data = urllib.request.urlopen(dataLink)
    data = data.readall().decode("utf-8")
    data = json.loads(data)


    data = data["btc_usd"]
    data = pd.DataFrame(data)

    buys = data[(data['type']=="bid")]
    buys["datestamp"] = np.array(buys["timestamp"]).astype("datetime64[s]")
    buyDates = (buys["datestamp"]).tolist()


    sells = data[(data['type']=="ask")]
    sells["datestamp"] = np.array(sells["timestamp"]).astype("datetime64[s]")
    sellDates = (sells["datestamp"]).tolist()

    a.clear()

    a.plot_date(buyDates, buys["price"], "#00A3E0", label="buys")
    a.plot_date(sellDates, sells["price"], "#183A54", label="sells")

    a.legend(bbox_to_anchor=(0, 1.02, 1, .102), loc=3,
             ncol=2, borderaxespad=0)

    title = "BTC-e BTCUSD Prices\nLast Price: "+str(data["price"][1999])
    a.set_title(title)


class SeaofBTCapp(tk.Tk):

    def __init__(self, *args, **kwargs):

        tk.Tk.__init__(self, *args, **kwargs)

        tk.Tk.iconbitmap(self, default="clienticon.ico")
        tk.Tk.wm_title(self, "Sea of BTC client")


        container = tk.Frame(self)
        container.pack(side="top", fill="both", expand = True)
        container.grid_rowconfigure(0, weight=1)
        container.grid_columnconfigure(0, weight=1)


        menubar = tk.Menu(container)
        filemenu = tk.Menu(menubar, tearoff=0)
        filemenu.add_command(label="Save settings", command = lambda: popupmsg("Not supported just yet!"))
        filemenu.add_separator()
        filemenu.add_command(label="Exit", command=quit)
        menubar.add_cascade(label="File", menu=filemenu)

        exchangeChoice = tk.Menu(menubar, tearoff=1)
        exchangeChoice.add_command(label="BTC-e",
                                   command=lambda: changeExchange("BTC-e","btce"))
        exchangeChoice.add_command(label="Bitfinex",
                                   command=lambda: changeExchange("Bitfinex","bitfinex"))
        exchangeChoice.add_command(label="Bitstamp",
                                   command=lambda: changeExchange("Bitstamp","bitstamp"))
        exchangeChoice.add_command(label="Huobi",
                                   command=lambda: changeExchange("Huobi","huobi"))

        menubar.add_cascade(label="Exchange", menu=exchangeChoice)

        dataTF = tk.Menu(menubar, tearoff=1)
        dataTF.add_command(label = "Tick",
                           command=lambda: changeTimeFrame('tick'))
        dataTF.add_command(label = "1 Day",
                           command=lambda: changeTimeFrame('1d'))
        dataTF.add_command(label = "3 Day",
                           command=lambda: changeTimeFrame('3d'))
        dataTF.add_command(label = "1 Week",
                           command=lambda: changeTimeFrame('7d'))
        menubar.add_cascade(label = "Data Time Frame", menu = dataTF)

        OHLCI = tk.Menu(menubar, tearoff=1)
        OHLCI.add_command(label = "Tick",
                           command=lambda: changeTimeFrame('tick'))
        OHLCI.add_command(label = "1 minute",
                           command=lambda: changeSampleSize('1Min', 0.0005))
        OHLCI.add_command(label = "5 minute",
                           command=lambda: changeSampleSize('5Min', 0.003))
        OHLCI.add_command(label = "15 minute",
                           command=lambda: changeSampleSize('15Min', 0.008))
        OHLCI.add_command(label = "30 minute",
                           command=lambda: changeSampleSize('30Min', 0.016))
        OHLCI.add_command(label = "1 Hour",
                           command=lambda: changeSampleSize('1H', 0.032))
        OHLCI.add_command(label = "3 Hour",
                           command=lambda: changeSampleSize('3H', 0.096))

        menubar.add_cascade(label="OHLC Interval", menu=OHLCI)


        topIndi = tk.Menu(menubar, tearoff=1)
        topIndi.add_command(label="None",
                            command = lambda: addTopIndicator('none'))
        topIndi.add_command(label="RSI",
                            command = lambda: addTopIndicator('rsi'))
        topIndi.add_command(label="MACD",
                            command = lambda: addTopIndicator('macd'))

        menubar.add_cascade(label="Top Indicator", menu=topIndi)


        mainI = tk.Menu(menubar, tearoff=1)
        mainI.add_command(label="None",
                            command = lambda: addMiddleIndicator('none'))
        mainI.add_command(label="SMA",
                            command = lambda: addMiddleIndicator('sma'))
        mainI.add_command(label="EMA",
                            command = lambda: addMiddleIndicator('ema'))

        menubar.add_cascade(label="Main/middle Indicator", menu=mainI)


        bottomI = tk.Menu(menubar, tearoff=1)
        bottomI.add_command(label="None",
                            command = lambda: addBottomIndicator('none'))
        bottomI.add_command(label="RSI",
                            command = lambda: addBottomIndicator('rsi'))
        bottomI.add_command(label="MACD",
                            command = lambda: addBottomIndicator('macd'))

        menubar.add_cascade(label="Bottom Indicator", menu=bottomI)


        tk.Tk.config(self, menu=menubar)

        self.frames = {}

        for F in (StartPage, BTCe_Page):

            frame = F(container, self)

            self.frames[F] = frame

            frame.grid(row=0, column=0, sticky="nsew")

        self.show_frame(StartPage)

    def show_frame(self, cont):

        frame = self.frames[cont]
        frame.tkraise()


class StartPage(tk.Frame):

    def __init__(self, parent, controller):
        tk.Frame.__init__(self,parent)
        label = tk.Label(self, text=("""ALPHA Bitcoin trading application
        use at your own risk. There is no promise
        of warranty."""), font=LARGE_FONT)
        label.pack(pady=10,padx=10)

        button1 = ttk.Button(self, text="Agree",
                            command=lambda: controller.show_frame(BTCe_Page))
        button1.pack()

        button2 = ttk.Button(self, text="Disagree",
                            command=quit)
        button2.pack()


class PageOne(tk.Frame):

    def __init__(self, parent, controller):
        tk.Frame.__init__(self, parent)
        label = tk.Label(self, text="Page One!!!", font=LARGE_FONT)
        label.pack(pady=10,padx=10)

        button1 = ttk.Button(self, text="Back to Home",
                            command=lambda: controller.show_frame(StartPage))
        button1.pack()


class BTCe_Page(tk.Frame):

    def __init__(self, parent, controller):
        tk.Frame.__init__(self, parent)
        label = tk.Label(self, text="Graph Page!", font=LARGE_FONT)
        label.pack(pady=10,padx=10)

        button1 = ttk.Button(self, text="Back to Home",
                            command=lambda: controller.show_frame(StartPage))
        button1.pack()


        canvas = FigureCanvasTkAgg(f, self)
        canvas.show()
        canvas.get_tk_widget().pack(side=tk.BOTTOM, fill=tk.BOTH, expand=True)

        toolbar = NavigationToolbar2TkAgg(canvas, self)
        toolbar.update()
        canvas._tkcanvas.pack(side=tk.TOP, fill=tk.BOTH, expand=True)


app = SeaofBTCapp()
app.geometry("1280x720")
ani = animation.FuncAnimation(f, animate, interval=5000)
app.mainloop()
-
Programming GUIs and windows with Tkinter and Python Introduction
-
Object Oriented Programming Crash Course with Tkinter
-
Passing functions with Parameters in Tkinter using Lambda
-
How to change and show a new window in Tkinter
-
Styling your GUI a bit using TTK
-
How to embed a Matplotlib graph to your Tkinter GUI
-
How to make the Matplotlib graph live in your application
-
Organizing our GUI
-
Plotting Live Updating Data in Matplotlib and our Tkinter GUI
-
Customizing an embedded Matplotlib Graph in Tkinter
-
Creating our Main Menu in Tkinter
-
Building a pop-up message window
-
Exchange Choice Option
-
Time-frame and sample size option
-
Adding indicator Menus (3 videos)
-
Trading option, start/stop, and help menu options
-
Tutorial on adding a tutorial
-
Allowing the exchange choice option to affect actual shown exchange
-
Adding exchange choice cont'd
-
Adding exchange choices part 3
-
Indicator Support
-
Pulling data from the Sea of BTC API
-
Setting up sub plots within our Tkinter GUI
-
Graphing an OHLC candlestick graph embedded in our Tkinter GUI
-
Acquiring RSI data from Sea of BTC API
-
Acquiring MACD data from Sea of BTC API
-
Converting Tkinter application to .exe and installer with cx_Freeze
