How to make the Matplotlib graph live in your application
Now that we have a graph, we want that graph to update live with new prices as they come in eventually, so how do we get this graph to update live? We can utilize our and merge it with our code here.
The other thing we're going to do is utilize Matplotlib styles to quickly improve the overall look of our graph. First we're going to need the following new imports added:
import matplotlib.animation as animation
This import brings in the animation functionality for Matplotlib.
Next:
from matplotlib import style
style.use('ggplot')
Here we import Matplotlib's style functionality. Having a problem with this? Download the latest version of Matplotlib.
You can also use pip to update using: pip install --update matplotlib in cmd.exe / bash.
If you need help with pip, check out the .
Now let's define our figure and subplot at the top of our script under the imports like:
f = Figure(figsize=(5,4), dpi=100)
a = f.add_subplot(111)
Next, for animating, we're going to make an animation function like so:
def animate(i):
    pullData = open('sampleText.txt','r').read()
    dataArray = pullData.split('\n')
    xar=[]
    yar=[]
    for eachLine in dataArray:
        if len(eachLine)>1:
            x,y = eachLine.split(',')
            xar.append(int(x))
            yar.append(int(y))
    a.clear()
    a.plot(xar,yar)
Notice sampleText.txt? Well that probably doesn't exist yet for you, so let's go ahead and make that. Just create a simple text file within the same directory as your script, and fill it like:
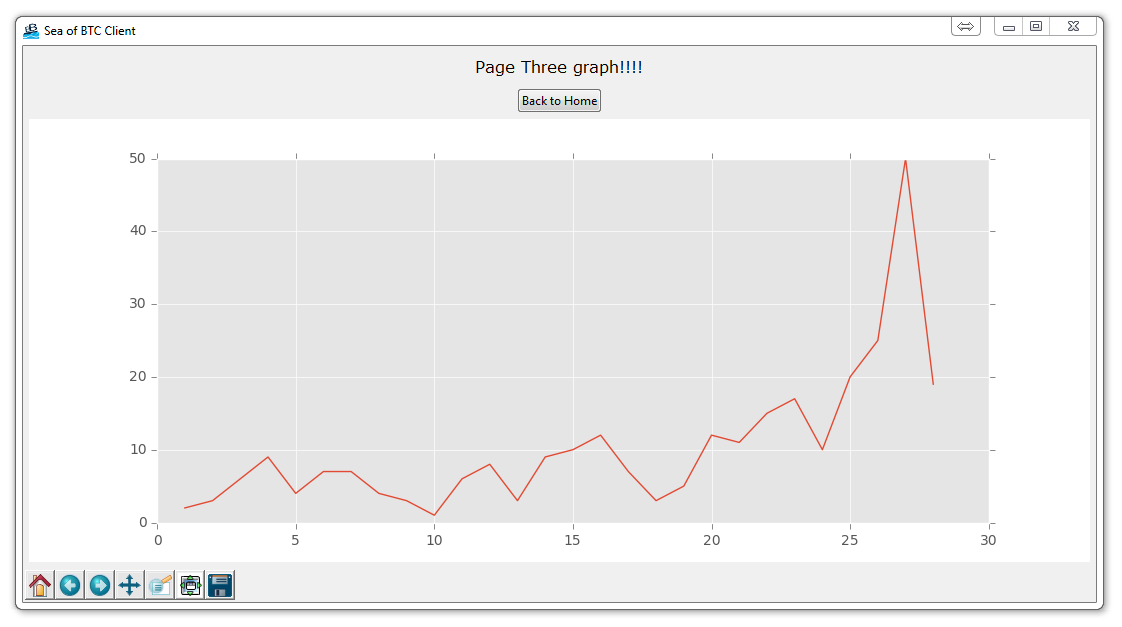
1,2
2,3
3,6
4,9
5,4
6,7
7,7
8,4
9,3
10,1
11,6
12,8
13,3
14,9
15,10
16,12
17,7
18,3
19,5
20,12
21,11
22,15
23,17
24,10
25,20
26,25
27,50
28,19
Next, let's modify our PageThree class to remove the previous graph that we made:
class PageThree(tk.Frame):

    def __init__(self, parent, controller):
        tk.Frame.__init__(self, parent)
        label = ttk.Label(self, text="Page Three graph!!!!", font=LARGE_FONT)
        label.pack(pady=10,padx=10)


        button1 = ttk.Button(self, text="Back to Home",
                            command=lambda: controller.show_frame(StartPage))
        button1.pack()


##        f = Figure(figsize=(5,4), dpi=100)
##        a = f.add_subplot(111)
##        t = arange(0.0,3.0,0.01)
##        s = sin(2*pi*t)
##
##        a.plot(t,s)

        canvas = FigureCanvasTkAgg(f, self)
        canvas.show()
        canvas.get_tk_widget().pack(side=tk.TOP, fill=tk.BOTH, expand=1)

        toolbar = NavigationToolbar2TkAgg( canvas, self )
        toolbar.update()
        canvas._tkcanvas.pack(side=tk.TOP, fill=tk.BOTH, expand=1)
Comment out your previous code like I have, or just simply delete it.
finally, at the bottom of our script, we need to add the animation function rules:
app = SeaofBTCapp()
####
ani = animation.FuncAnimation(f,animate, interval=1000)
####
app.mainloop()
Your end result should be a window, and when clicking on the button for page three:
Now, you can feel free to modify your text file with data in it, and, when you hit save, you should see your graph update live in your GUI!
In case you fell behind, here is the full code up to this point:
# The code for changing pages was derived from: http://stackoverflow.com/questions/7546050/switch-between-two-frames-in-tkinter
# License: http://creativecommons.org/licenses/by-sa/3.0/

import matplotlib
matplotlib.use("TkAgg")
from matplotlib.backends.backend_tkagg import FigureCanvasTkAgg, NavigationToolbar2TkAgg
from matplotlib.figure import Figure
import matplotlib.animation as animation
from matplotlib import style

import tkinter as tk
from tkinter import ttk


LARGE_FONT= ("Verdana", 12)
style.use("ggplot")

f = Figure(figsize=(5,5), dpi=100)
a = f.add_subplot(111)


def animate(i):
    pullData = open("sampleText.txt","r").read()
    dataList = pullData.split('\n')
    xList = []
    yList = []
    for eachLine in dataList:
        if len(eachLine) > 1:
            x, y = eachLine.split(',')
            xList.append(int(x))
            yList.append(int(y))

    a.clear()
    a.plot(xList, yList)


class SeaofBTCapp(tk.Tk):

    def __init__(self, *args, **kwargs):

        tk.Tk.__init__(self, *args, **kwargs)

        tk.Tk.iconbitmap(self, default="clienticon.ico")
        tk.Tk.wm_title(self, "Sea of BTC client")


        container = tk.Frame(self)
        container.pack(side="top", fill="both", expand = True)
        container.grid_rowconfigure(0, weight=1)
        container.grid_columnconfigure(0, weight=1)

        self.frames = {}

        for F in (StartPage, PageOne, PageTwo, PageThree):

            frame = F(container, self)

            self.frames[F] = frame

            frame.grid(row=0, column=0, sticky="nsew")

        self.show_frame(StartPage)

    def show_frame(self, cont):

        frame = self.frames[cont]
        frame.tkraise()


class StartPage(tk.Frame):

    def __init__(self, parent, controller):
        tk.Frame.__init__(self,parent)
        label = tk.Label(self, text="Start Page", font=LARGE_FONT)
        label.pack(pady=10,padx=10)

        button = ttk.Button(self, text="Visit Page 1",
                            command=lambda: controller.show_frame(PageOne))
        button.pack()

        button2 = ttk.Button(self, text="Visit Page 2",
                            command=lambda: controller.show_frame(PageTwo))
        button2.pack()

        button3 = ttk.Button(self, text="Graph Page",
                            command=lambda: controller.show_frame(PageThree))
        button3.pack()


class PageOne(tk.Frame):

    def __init__(self, parent, controller):
        tk.Frame.__init__(self, parent)
        label = tk.Label(self, text="Page One!!!", font=LARGE_FONT)
        label.pack(pady=10,padx=10)

        button1 = ttk.Button(self, text="Back to Home",
                            command=lambda: controller.show_frame(StartPage))
        button1.pack()

        button2 = ttk.Button(self, text="Page Two",
                            command=lambda: controller.show_frame(PageTwo))
        button2.pack()


class PageTwo(tk.Frame):

    def __init__(self, parent, controller):
        tk.Frame.__init__(self, parent)
        label = tk.Label(self, text="Page Two!!!", font=LARGE_FONT)
        label.pack(pady=10,padx=10)

        button1 = ttk.Button(self, text="Back to Home",
                            command=lambda: controller.show_frame(StartPage))
        button1.pack()

        button2 = ttk.Button(self, text="Page One",
                            command=lambda: controller.show_frame(PageOne))
        button2.pack()


class PageThree(tk.Frame):

    def __init__(self, parent, controller):
        tk.Frame.__init__(self, parent)
        label = tk.Label(self, text="Graph Page!", font=LARGE_FONT)
        label.pack(pady=10,padx=10)

        button1 = ttk.Button(self, text="Back to Home",
                            command=lambda: controller.show_frame(StartPage))
        button1.pack()


        canvas = FigureCanvasTkAgg(f, self)
        canvas.show()
        canvas.get_tk_widget().pack(side=tk.BOTTOM, fill=tk.BOTH, expand=True)

        toolbar = NavigationToolbar2TkAgg(canvas, self)
        toolbar.update()
        canvas._tkcanvas.pack(side=tk.TOP, fill=tk.BOTH, expand=True)


app = SeaofBTCapp()
ani = animation.FuncAnimation(f, animate, interval=1000)
app.mainloop()
-
Programming GUIs and windows with Tkinter and Python Introduction
-
Object Oriented Programming Crash Course with Tkinter
-
Passing functions with Parameters in Tkinter using Lambda
-
How to change and show a new window in Tkinter
-
Styling your GUI a bit using TTK
-
How to embed a Matplotlib graph to your Tkinter GUI
-
How to make the Matplotlib graph live in your application
-
Organizing our GUI
-
Plotting Live Updating Data in Matplotlib and our Tkinter GUI
-
Customizing an embedded Matplotlib Graph in Tkinter
-
Creating our Main Menu in Tkinter
-
Building a pop-up message window
-
Exchange Choice Option
-
Time-frame and sample size option
-
Adding indicator Menus (3 videos)
-
Trading option, start/stop, and help menu options
-
Tutorial on adding a tutorial
-
Allowing the exchange choice option to affect actual shown exchange
-
Adding exchange choice cont'd
-
Adding exchange choices part 3
-
Indicator Support
-
Pulling data from the Sea of BTC API
-
Setting up sub plots within our Tkinter GUI
-
Graphing an OHLC candlestick graph embedded in our Tkinter GUI
-
Acquiring RSI data from Sea of BTC API
-
Acquiring MACD data from Sea of BTC API
-
Converting Tkinter application to .exe and installer with cx_Freeze
