Graphing our images in Matplotlib
Now we're going to cover how to see the image array visually. Obviously, we start with images that we can already see, but soon we're going to start manipulating the images a bit. To see our changes, we could save to an image and then look at it, but it will be quicker and easier to display it via our program.
For this, we're going to use Matplotlib.
With some additional ending code, you can show the image:
from PIL import Image
import numpy as np
####
import matplotlib.pyplot as plt
###
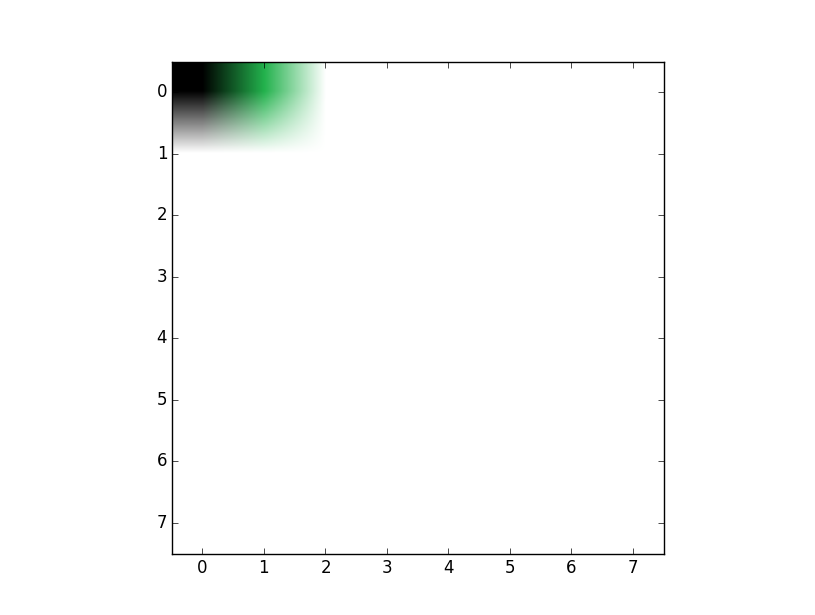
i = Image.open('images/dotndot.png')
iar = np.asarray(i)
plt.imshow(iar)
print(iar)
plt.show()
The result should be something like:
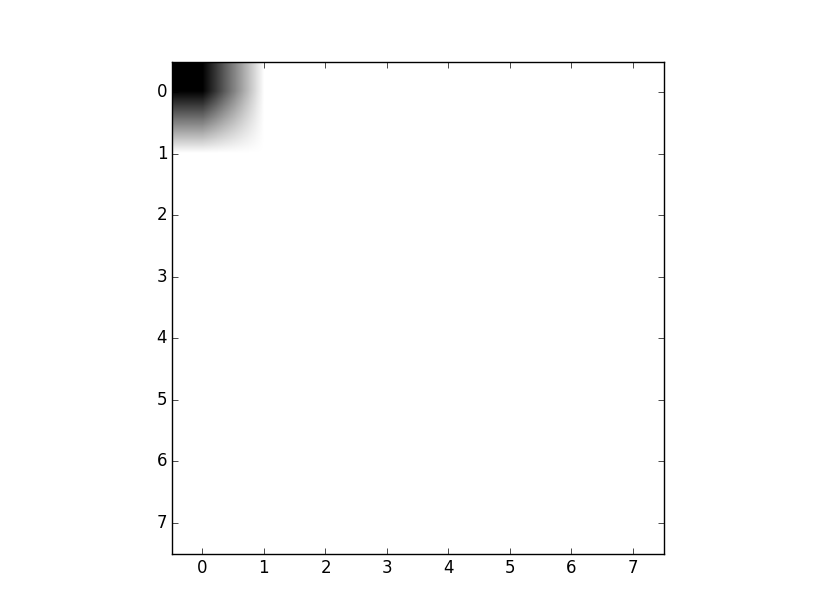
Now try another, let's change dotndot.png to just dot.png.
That's it for a quick example of displaying our data. There is a lot more to Matplotlib if you're curious, you can head to the Matplotlib Tutorials.
