Testing, visualization, and moving forward
Now let's cover how to visually show the results, try some more examples, and then talk about some ideas for moving forward.
Here is the modified script to include matplotlib, and I will also copy and paste everything, so this is the full script for this series:
from PIL import Image
import numpy as np
import matplotlib.pyplot as plt
import time
from collections import Counter
from matplotlib import style
style.use("ggplot")
def createExamples():
numberArrayExamples = open('numArEx.txt','a')
numbersWeHave = range(1,10)
for eachNum in numbersWeHave:
for furtherNum in numbersWeHave:
imgFilePath = 'images/numbers/'+str(eachNum)+'.'+str(furtherNum)+'.png'
ei = Image.open(imgFilePath)
eiar = np.array(ei)
eiarl = str(eiar.tolist())
lineToWrite = str(eachNum)+'::'+eiarl+'\n'
numberArrayExamples.write(lineToWrite)
def threshold(imageArray):
balanceAr = []
newAr = imageArray
for eachPart in imageArray:
for theParts in eachPart:
# for the reduce(lambda x, y: x + y, theParts[:3]) / len(theParts[:3])
# in Python 3, just use: from statistics import mean
# then do avgNum = mean(theParts[:3])
avgNum = reduce(lambda x, y: x + y, theParts[:3]) / len(theParts[:3])
balanceAr.append(avgNum)
balance = reduce(lambda x, y: x + y, balanceAr) / len(balanceAr)
for eachRow in newAr:
for eachPix in eachRow:
if reduce(lambda x, y: x + y, eachPix[:3]) / len(eachPix[:3]) > balance:
eachPix[0] = 255
eachPix[1] = 255
eachPix[2] = 255
eachPix[3] = 255
else:
eachPix[0] = 0
eachPix[1] = 0
eachPix[2] = 0
eachPix[3] = 255
return newAr
def whatNumIsThis(filePath):
matchedAr = []
loadExamps = open('numArEx.txt','r').read()
loadExamps = loadExamps.split('\n')
i = Image.open(filePath)
iar = np.array(i)
iarl = iar.tolist()
inQuestion = str(iarl)
for eachExample in loadExamps:
try:
splitEx = eachExample.split('::')
currentNum = splitEx[0]
currentAr = splitEx[1]
eachPixEx = currentAr.split('],')
eachPixInQ = inQuestion.split('],')
x = 0
while x < len(eachPixEx):
if eachPixEx[x] == eachPixInQ[x]:
matchedAr.append(int(currentNum))
x+=1
except Exception as e:
print(str(e))
x = Counter(matchedAr)
print(x)
graphX = []
graphY = []
ylimi = 0
for eachThing in x:
graphX.append(eachThing)
graphY.append(x[eachThing])
ylimi = x[eachThing]
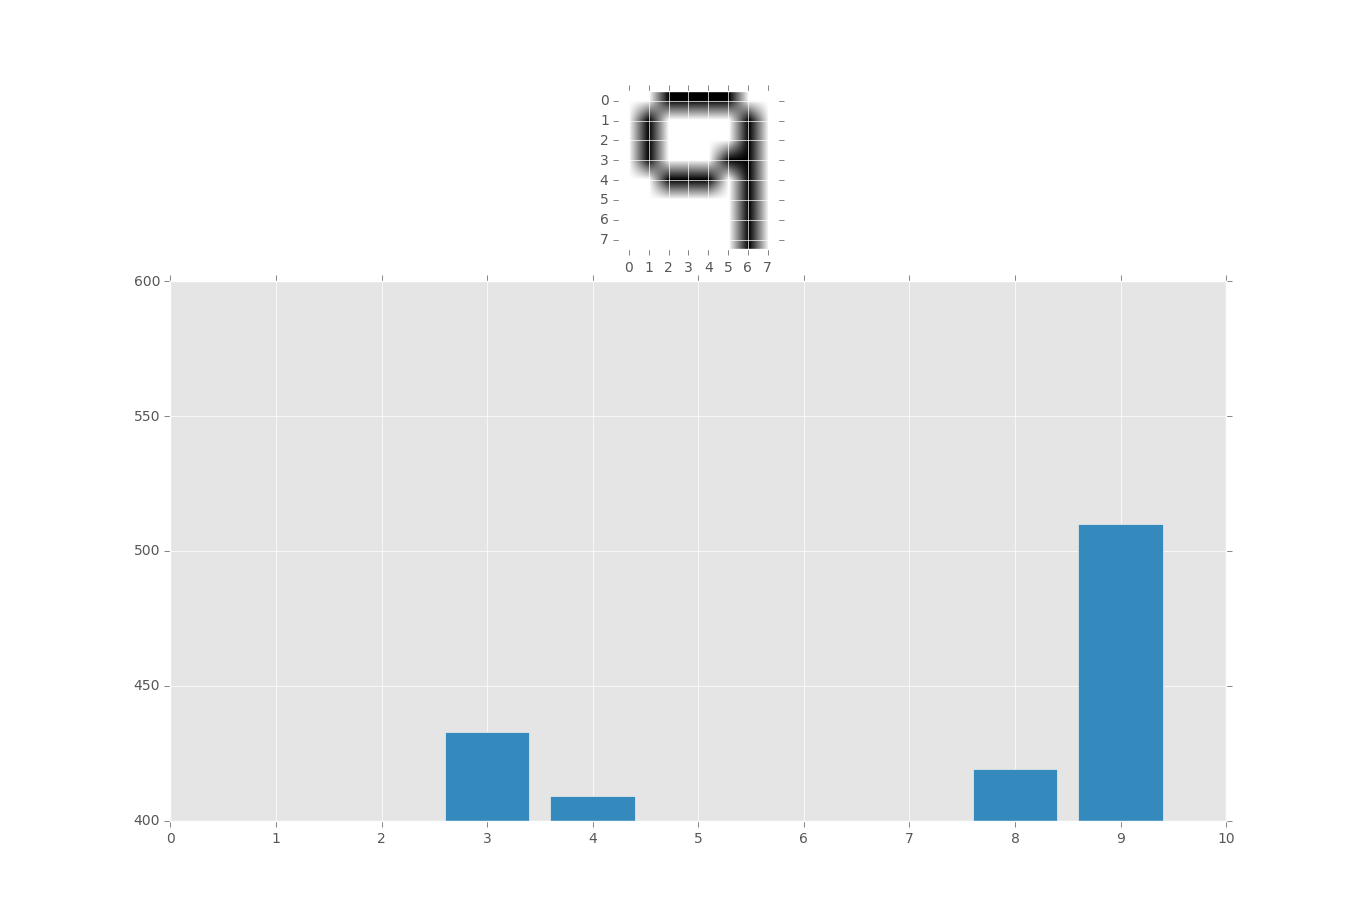
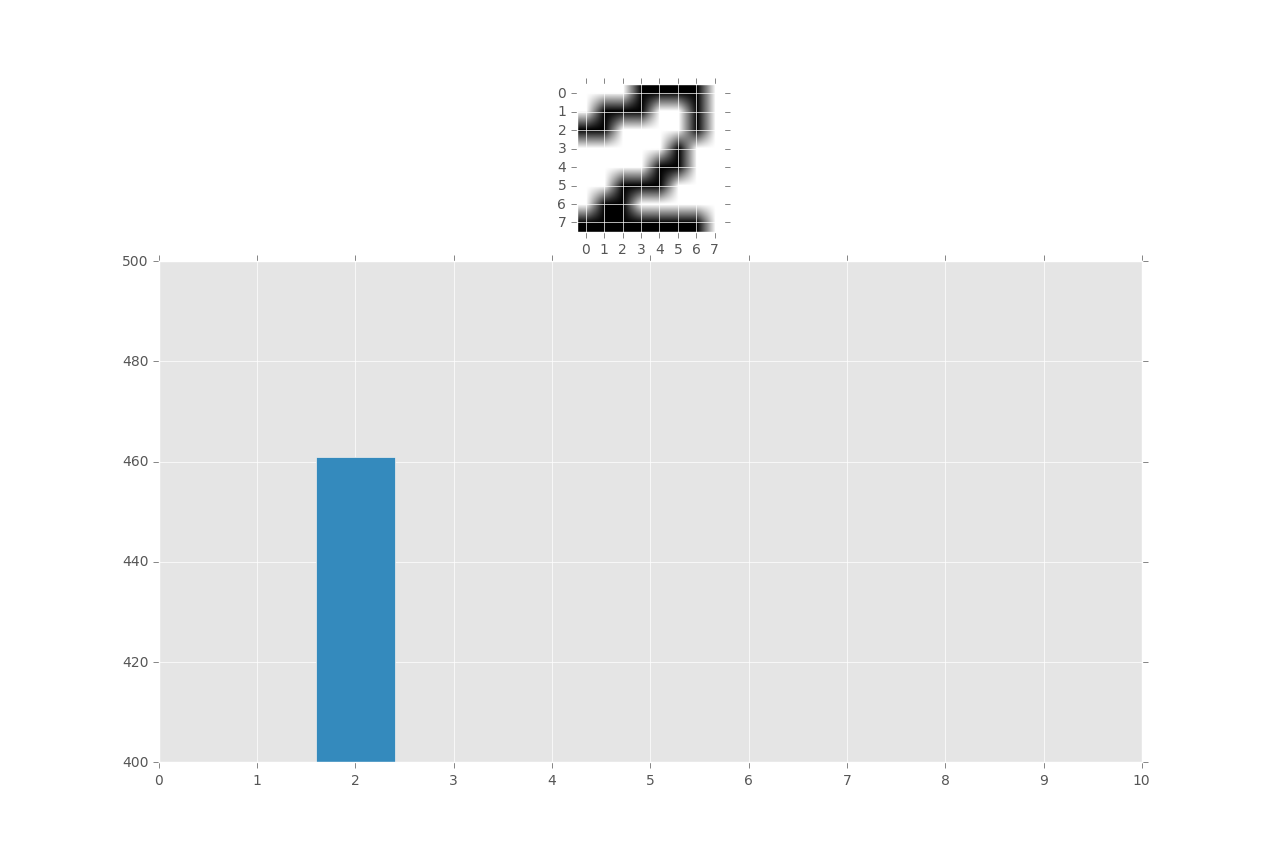
fig = plt.figure()
ax1 = plt.subplot2grid((4,4),(0,0), rowspan=1, colspan=4)
ax2 = plt.subplot2grid((4,4),(1,0), rowspan=3,colspan=4)
ax1.imshow(iar)
ax2.bar(graphX,graphY,align='center')
plt.ylim(400)
xloc = plt.MaxNLocator(12)
ax2.xaxis.set_major_locator(xloc)
plt.show()
whatNumIsThis('images/test.png')
I encourage you to open up paint or something similar, create an 8 x 8 square, and draw your own numbers. You could use some of the training set, but this is highly improper.
Try drawing numbers and then shifting them a bit left or right, or up and down.
You should find some pretty decent success here, though there are obviously many problems moving forward from here. So far, we normalized images to be either white or black, but everything was 8x8. You wont always be this lucky, but you can indeed resize. The thickness of our characters was also very standard.
The main objective of this series was to teach you that, while image recognition is a somewhat complex topic in layers, each problem can be broken down and solved with very simple, easily understood, code. I hope you enjoyed.
That is the end of this series. Want more tutorials? Head to the
