Thresholding Function
Now what we want to do is create a function that will take the images we feed it, and threshold it. The way we're going to do this is by taking the "average" color value, and then thresholding any pixel as black if it is any darker or white if it is lighter.
To start, let's delete everything but the imports, leaving:
from PIL import Image
import numpy as np

import matplotlib.pyplot as plt
import time
Then we'll begin our threshold function:
def threshold(imageArray):
    balanceAr = []
    newAr = imageArray
Above, we define the function, and we specify that we're expecting a parameter, the imageArray. This will be that array that we've been seeing with the pixel values.
Next, we define the balanceAr as an empty list, and the newAr, for now, is the imageArray. We cannot modify the actual iar without NumPy throwing a fit, so we do this. Balance array, at the end, will be averaged, to find our threshold.
Now we begin a for loop. Within this for loop we have some code that is not compatible between Python versions. I will just put a Python 2 and Python 3 version here.
Python 2:
    for eachRow in imageArray:
        for eachPix in eachRow:
            avgNum = reduce(lambda x, y: x + y, eachPix[:3]) / len(eachPix[:3])
            balanceAr.append(avgNum)
Python 3:
    from statistics import mean
    for eachRow in imageArray:
        for eachPix in eachRow:
            avgNum = mean(eachPix[:3])
            balanceAr.append(avgNum)
Next, our goal is to apply this function to some images, so let's add some images here:
i = Image.open('images/numbers/0.1.png')
iar = np.array(i)
i2 = Image.open('images/numbers/y0.4.png')
iar2 = np.array(i2)
i3 = Image.open('images/numbers/y0.5.png')
iar3 = np.array(i3)
i4 = Image.open('images/sentdex.png')
iar4 = np.array(i4)


fig = plt.figure()
ax1 = plt.subplot2grid((8,6),(0,0), rowspan=4, colspan=3)
ax2 = plt.subplot2grid((8,6),(4,0), rowspan=4, colspan=3)
ax3 = plt.subplot2grid((8,6),(0,3), rowspan=4, colspan=3)
ax4 = plt.subplot2grid((8,6),(4,3), rowspan=4, colspan=3)

ax1.imshow(iar)
ax2.imshow(iar2)
ax3.imshow(iar3)
ax4.imshow(iar4)


plt.show()
Run the script and you should see:
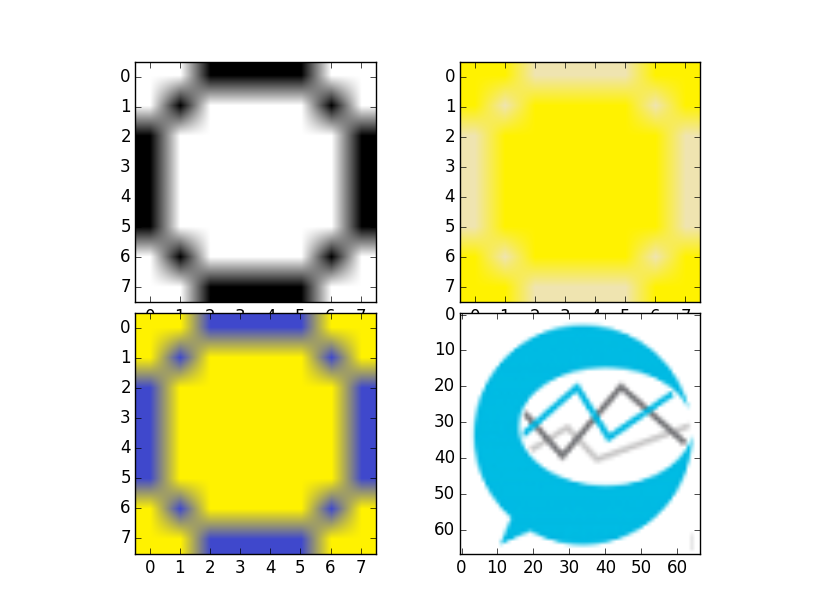
Now what we want to do is threshold the images, so then we'll see that the zeros look all the same, and then you'll see it work in an image with more than two colors.
