Thresholding Logic
Now we're going to go ahead and finish the thresholding function. Again, there will be a Python 2 and Python 3 version.
Python 2
def threshold(imageArray):
    balanceAr = []
    newAr = imageArray
    for eachRow in imageArray:
        for eachPix in eachRow:
            avgNum = reduce(lambda x, y: x + y, eachPix[:3]) / len(eachPix[:3])
            balanceAr.append(avgNum)
    balance = reduce(lambda x, y: x + y, balanceAr) / len(balanceAr)
    for eachRow in newAr:
        for eachPix in eachRow:
            if reduce(lambda x, y: x + y, eachPix[:3]) / len(eachPix[:3]) > balance:
                eachPix[0] = 255
                eachPix[1] = 255
                eachPix[2] = 255
                eachPix[3] = 255
            else:
                eachPix[0] = 0
                eachPix[1] = 0
                eachPix[2] = 0
                eachPix[3] = 255
    return newAr
Python 3
def threshold(imageArray):

    balanceAr = []
    newAr = imageArray
    from statistics import mean
    for eachRow in imageArray:
        for eachPix in eachRow:
            avgNum = mean(eachPix[:3])
            balanceAr.append(avgNum)

    balance = mean(balanceAr)
    for eachRow in newAr:
        for eachPix in eachRow:
            if mean(eachPix[:3]) > balance:
                eachPix[0] = 255
                eachPix[1] = 255
                eachPix[2] = 255
                eachPix[3] = 255
            else:
                eachPix[0] = 0
                eachPix[1] = 0
                eachPix[2] = 0
                eachPix[3] = 255
    return newAr
What we've added for now is, from the average of the balance array, we then assess each pixel. If the pixel is brighter than the average, then it is a white. If it is darker than the average, then it is black.
Now, what we can do with this function is feed in the image array, and we're going to be returned the thresholded image array.
Remember our first image was:
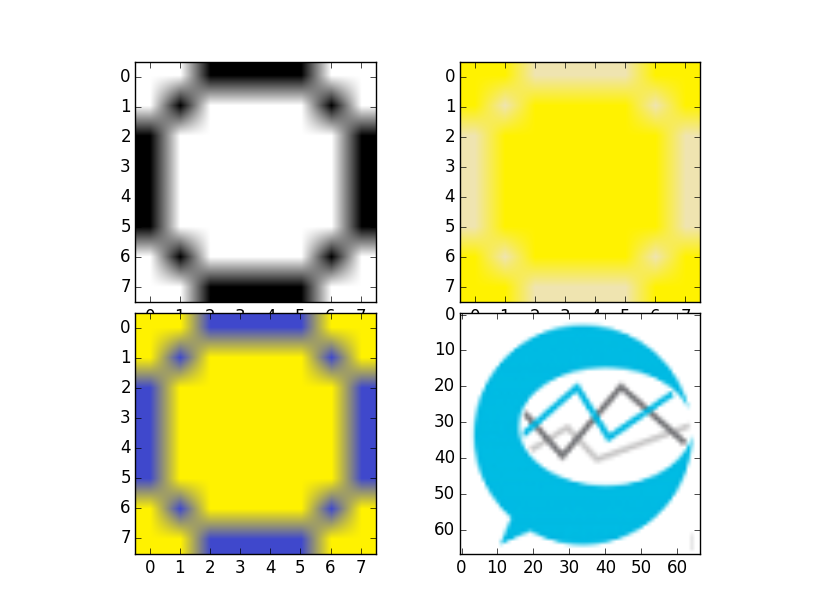
Now let us apply the threshold to everything
i = Image.open('images/numbers/0.1.png')
iar = np.array(i)
i2 = Image.open('images/numbers/y0.4.png')
iar2 = np.array(i2)
i3 = Image.open('images/numbers/y0.5.png')
iar3 = np.array(i3)
i4 = Image.open('images/sentdex.png')
iar4 = np.array(i4)


iar = threshold(iar)
iar2 = threshold(iar2)
iar3 = threshold(iar3)
iar4 = threshold(iar4)

fig = plt.figure()
ax1 = plt.subplot2grid((8,6),(0,0), rowspan=4, colspan=3)
ax2 = plt.subplot2grid((8,6),(4,0), rowspan=4, colspan=3)
ax3 = plt.subplot2grid((8,6),(0,3), rowspan=4, colspan=3)
ax4 = plt.subplot2grid((8,6),(4,3), rowspan=4, colspan=3)

ax1.imshow(iar)
ax2.imshow(iar2)
ax3.imshow(iar3)
ax4.imshow(iar4)


plt.show()
The resulting threshold applied to our images gives us:
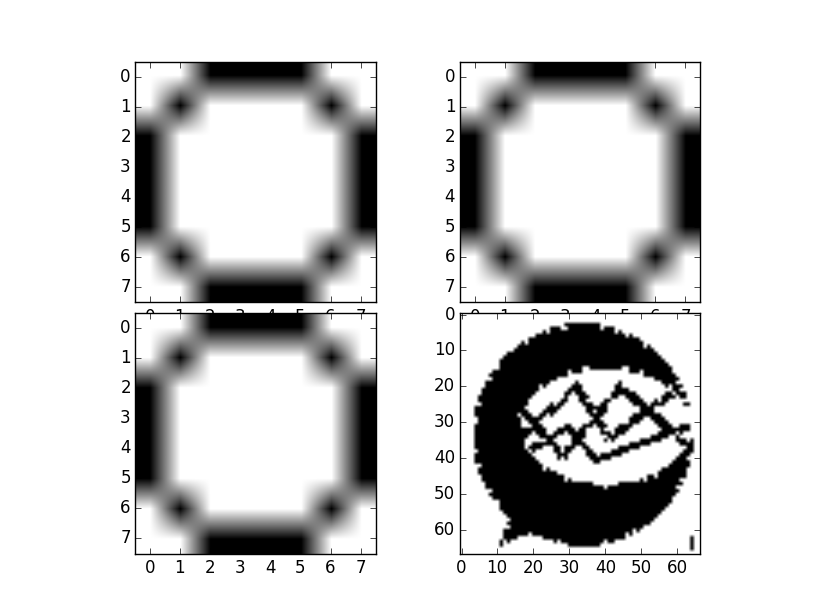
Awesome, looks good. Now we have a way to normalize our data with threshold. With this, we're ready to move on and start storing patterns for recognition, based on our sample data.
