More Pixel Arrays
For reference, here's the picture again:
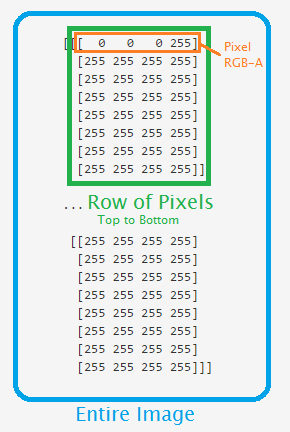
So each pixel is measured in RBGA, so an example row is [255, 255, 255, 255], what does that mean?
This means we're looking at a 256-color image, since programming starts with a 0 rather than a 1. This color means 255 red, 255 green, 255 blue, and then 255 Alpha.
Alpha is a measure of how opaque an image is. The higher the number, the more solid the color is, the lower the number, the more transparent it is.
Try now running the following with another image:
from PIL import Image
import numpy as np
i = Image.open('images/dotndot.png')

iar = np.asarray(i)

print(iar)
This has a black dot with another that is green-ish colored from the images directory. Notice the pixel values change.
