3D graphs in Matplotlib
Once you get comfortable with the 2D graphing, you might be interested in learning how to plot three-dimensional charts. 3D graphs add more perspective and comparison to your charts, and just plain look cool! Luckily for us, 3D graphs are pretty easy to learn and program with Matplotlib.
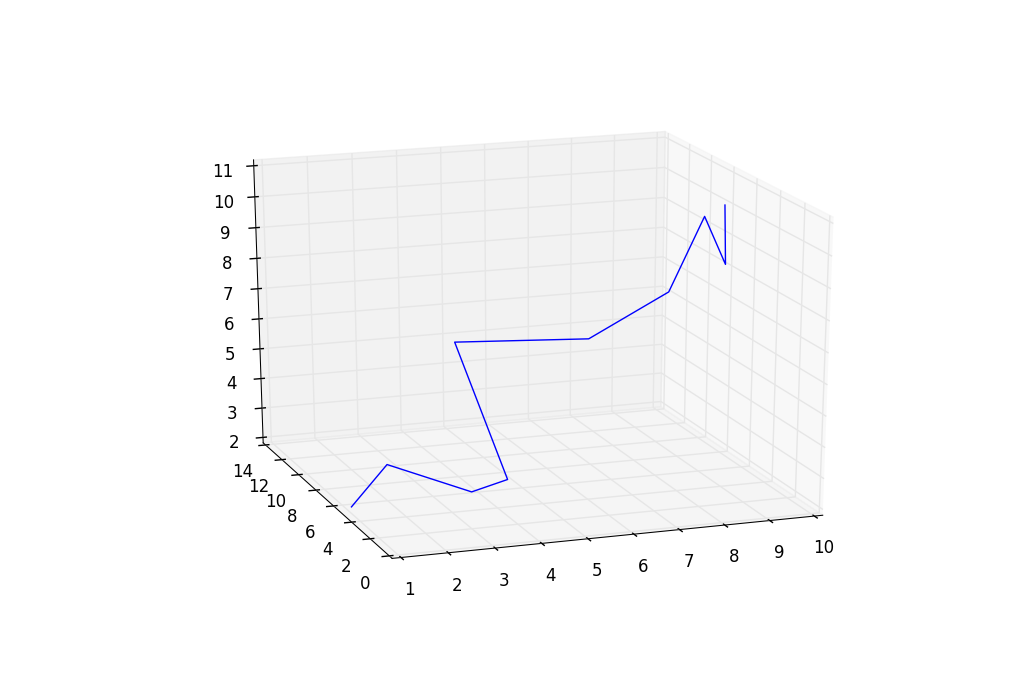
Here is some quick and simple, with hard-coded values, for a 3-D matplotlib wire chart.
from mpl_toolkits.mplot3d import axes3d
import matplotlib.pyplot as plt
import numpy as np

fig = plt.figure()
ax = fig.add_subplot(111, projection='3d')
X, Y, Z = [1,2,3,4,5,6,7,8,9,10],[5,6,2,3,13,4,1,2,4,8],[2,3,3,3,5,7,9,11,9,10]
ax.plot_wireframe(X, Y, Z)

plt.show()
-
Matplotlib Crash Course
-
3D graphs in Matplotlib
-
3D Scatter Plot with Python and Matplotlib
-
More 3D scatter-plotting with custom colors
-
3D Barcharts
-
3D Plane wireframe Graph
-
Live Updating Graphs with Matplotlib Tutorial
-
Modify Data Granularity for Graphing Data
-
Geographical Plotting with Basemap and Python p. 1
-
Geographical Plotting with Basemap and Python p. 2
-
Geographical Plotting with Basemap and Python p. 3
-
Geographical Plotting with Basemap and Python p. 4
-
Geographical Plotting with Basemap and Python p. 5
-
Advanced Matplotlib Series (videos and ending source only)
