
Modify Data Granularity for Graphing Data
If you happen to be plotting data that has a lot of data points, you will probably find that loading time is fairly extensive. A sample set of data can be found here, though you can also feel free to use your own data.
'''
Sample data is located: http://sentdex.com/GBPUSD.zip
'''

import matplotlib
import matplotlib.pyplot as plt
import matplotlib.ticker as mticker
import matplotlib.dates as mdates
import numpy as np

def graphRawFX():
    date,bid,ask = np.loadtxt('GBPUSD1d.txt', unpack=True,
                              delimiter=',',
                              converters={0:mdates.strpdate2num('%Y%m%d%H%M%S')})

    fig=plt.figure(figsize=(10,7))

    ax1 = plt.subplot2grid((40,40), (0,0), rowspan=40, colspan=40)
    ax1.plot(date,bid)
    ax1.plot(date,ask)

    ax1.xaxis.set_major_formatter(mdates.DateFormatter('%Y-%m-%d %H:%M:%S'))

    for label in ax1.xaxis.get_ticklabels():
            label.set_rotation(45)
    plt.subplots_adjust(bottom=.23)
    plt.gca().get_yaxis().get_major_formatter().set_useOffset(False)
    plt.grid(True)
    plt.show()
Here are some example photos of the visible changes by changing granularity:
No change in data granularity before rendering, showing 62,000 plots:
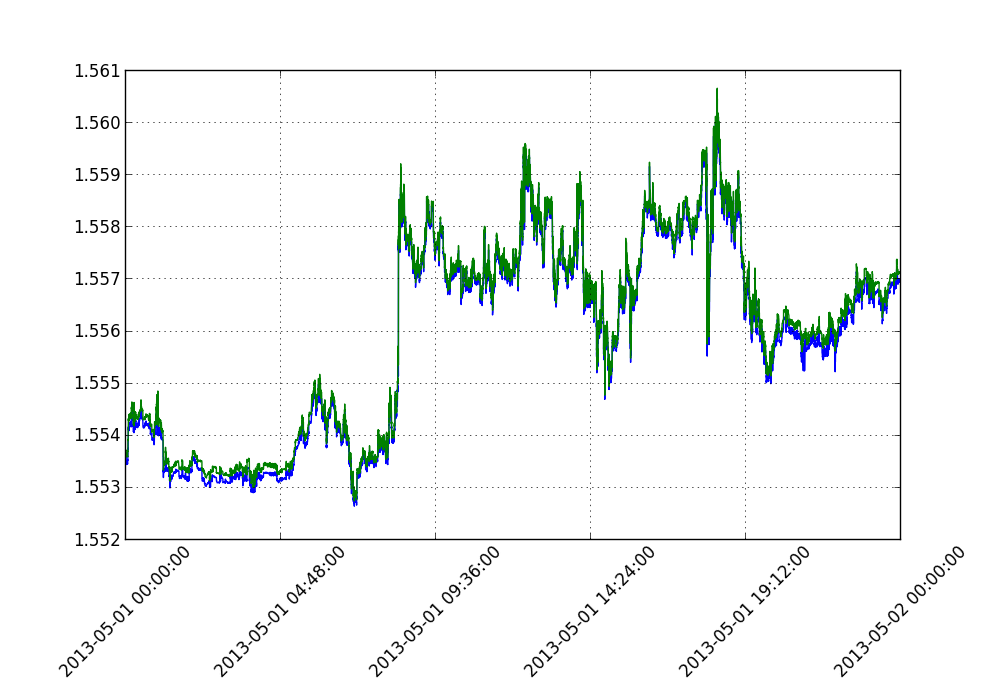
This chart shows the full 62,000 plots, with no change made to the granularity.
1/5th granularity, cutting the data points from 62,000 plots to 12,400 plots:
Aside from the thickness of the lines, the actual trajectory is left unaffected.
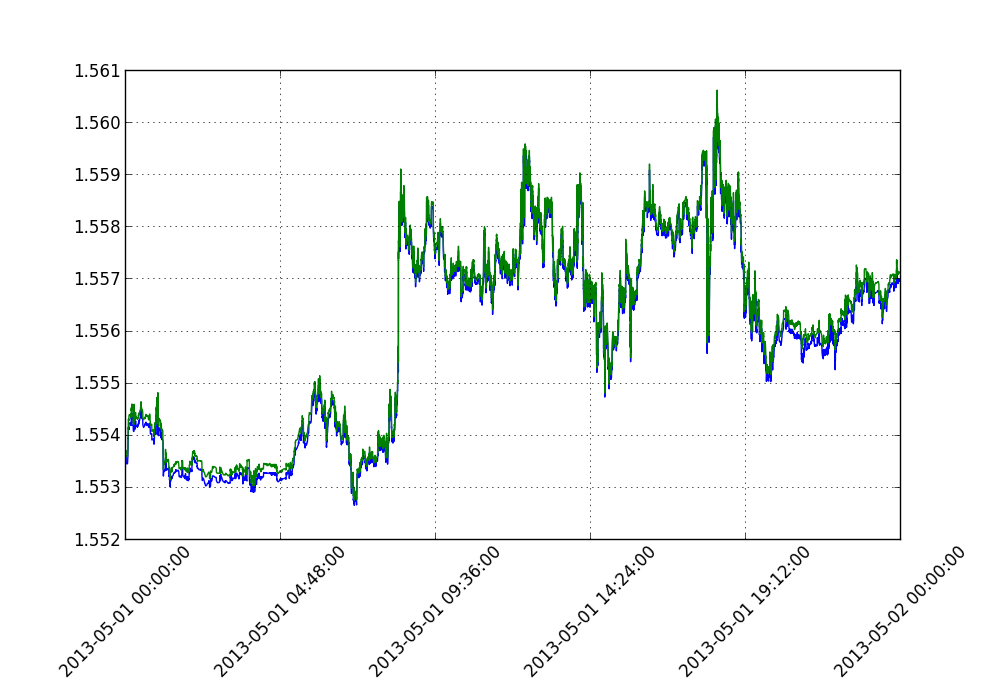
This image shows one fifth data granularity, from 62,000 plots to 12,400 plots. No noticeable change for the eyes.
1/15 granularity, from 62,000 plots to just ~4,100 plots. Some noticeable change, but trajectory still very much in tact
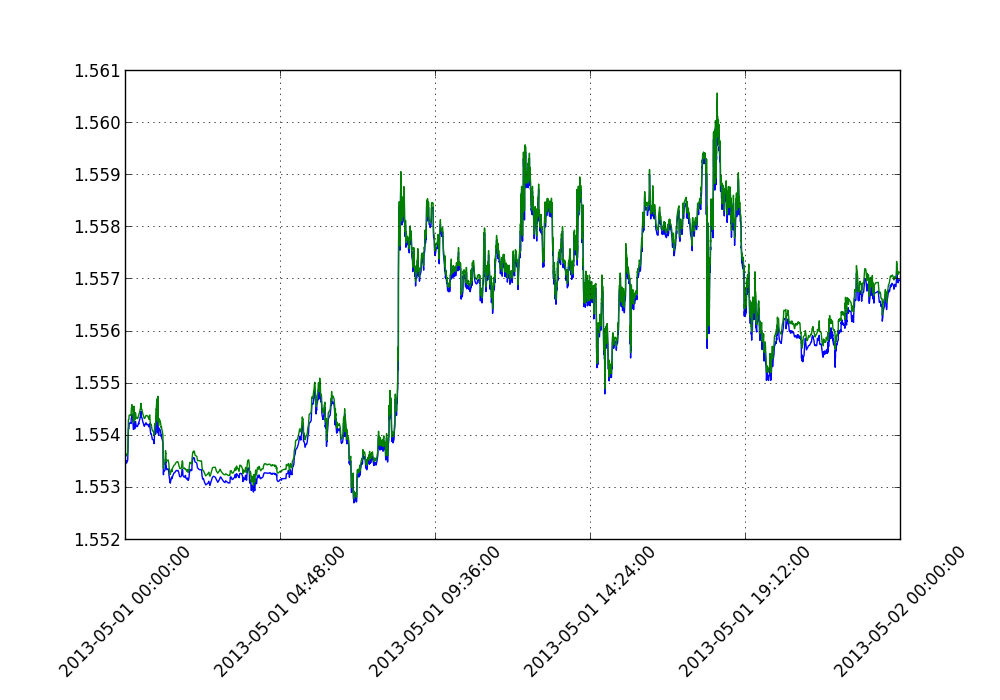 Now we can begin to notice the difference, but the meaning of the data is certainly not lost, yet the data size is MUCH smaller
-
Matplotlib Crash Course
-
3D graphs in Matplotlib
-
3D Scatter Plot with Python and Matplotlib
-
More 3D scatter-plotting with custom colors
-
3D Barcharts
-
3D Plane wireframe Graph
-
Live Updating Graphs with Matplotlib Tutorial
-
Modify Data Granularity for Graphing Data
-
Geographical Plotting with Basemap and Python p. 1
-
Geographical Plotting with Basemap and Python p. 2
-
Geographical Plotting with Basemap and Python p. 3
-
Geographical Plotting with Basemap and Python p. 4
-
Geographical Plotting with Basemap and Python p. 5
-
Advanced Matplotlib Series (videos and ending source only)
