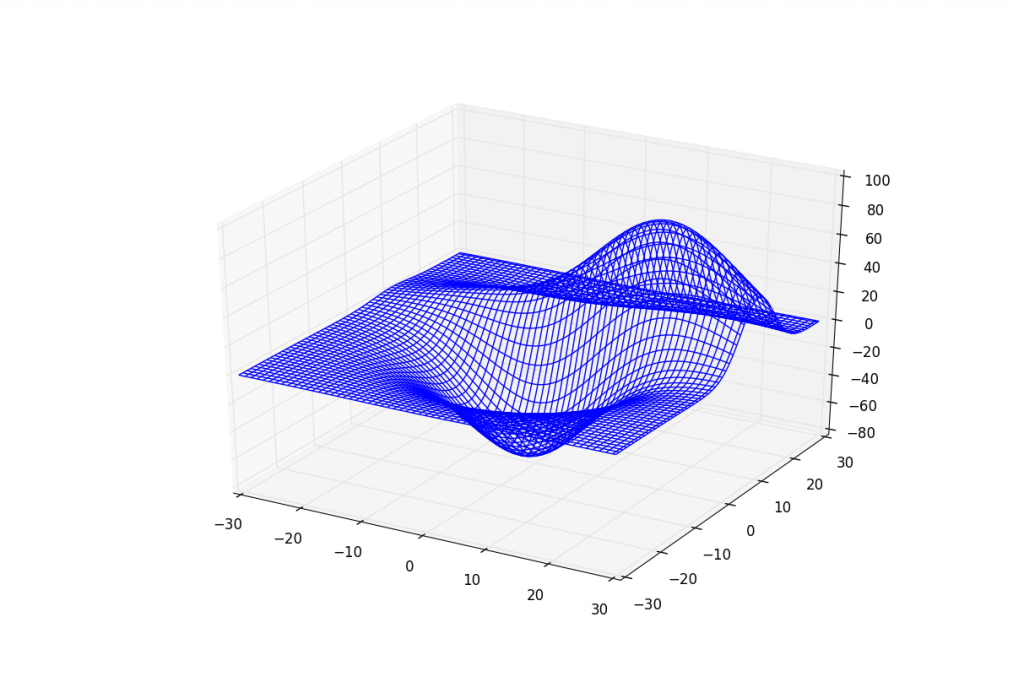
3D Plane wireframe Graph
In this tutorial, we cover how to make a wire frame / plane graph in Matplotlib. For this, we're just going to use the sample data provided by Matplotlib and leave it there. This type of graph is very specific in its application. If you happen to have your own data, feel free to substitute!
The below code covers an example. I have included the commented out function that generates test data for this, in case you are curious:
from mpl_toolkits.mplot3d import axes3d
import matplotlib.pyplot as plt
import numpy as np

'''
def get_test_data(delta=0.05):

    from matplotlib.mlab import  bivariate_normal
    x = y = np.arange(-3.0, 3.0, delta)
    X, Y = np.meshgrid(x, y)

    Z1 = bivariate_normal(X, Y, 1.0, 1.0, 0.0, 0.0)
    Z2 = bivariate_normal(X, Y, 1.5, 0.5, 1, 1)
    Z = Z2 - Z1

    X = X * 10
    Y = Y * 10
    Z = Z * 500
    return X, Y, Z

'''


fig = plt.figure()
ax = fig.add_subplot(111, projection='3d')

x, y, z = axes3d.get_test_data(0.05)
ax.plot_wireframe(x,y,z, rstride=2, cstride=2)

plt.show()
Not going to cover it officially, but check out:
from __future__ import print_function
"""
A very simple 'animation' of a 3D plot
"""
from mpl_toolkits.mplot3d import axes3d
import matplotlib.pyplot as plt
import numpy as np
import time

def generate(X, Y, phi):
    R = 1 - np.sqrt(X**2 + Y**2)
    return np.cos(2 * np.pi * X + phi) * R

plt.ion()
fig = plt.figure()
ax = fig.add_subplot(111, projection='3d')

xs = np.linspace(-1, 1, 50)
ys = np.linspace(-1, 1, 50)
X, Y = np.meshgrid(xs, ys)
Z = generate(X, Y, 0.0)

wframe = None
tstart = time.time()
for phi in np.linspace(0, 360 / 2 / np.pi, 100):

    oldcol = wframe

    Z = generate(X, Y, phi)
    wframe = ax.plot_wireframe(X, Y, Z, rstride=2, cstride=2)

    # Remove old line collection before drawing
    if oldcol is not None:
        ax.collections.remove(oldcol)

    plt.draw()

print ('FPS: %f' % (100 / (time.time() - tstart)))
-
Matplotlib Crash Course
-
3D graphs in Matplotlib
-
3D Scatter Plot with Python and Matplotlib
-
More 3D scatter-plotting with custom colors
-
3D Barcharts
-
3D Plane wireframe Graph
-
Live Updating Graphs with Matplotlib Tutorial
-
Modify Data Granularity for Graphing Data
-
Geographical Plotting with Basemap and Python p. 1
-
Geographical Plotting with Basemap and Python p. 2
-
Geographical Plotting with Basemap and Python p. 3
-
Geographical Plotting with Basemap and Python p. 4
-
Geographical Plotting with Basemap and Python p. 5
-
Advanced Matplotlib Series (videos and ending source only)
