Time-frame and sample size option
Now that we're getting good at adding new options, let's add a few more! We're going to need to allow the user to change the time frame of data to consider, like 1 day or 1 week. Then we also want the user to be able to set the time length of each "bar" of open, high, low and close data (how much each "bar" or "Candlestick" will consider).
First, we need the variables:
resampleSize = "15Min"
DataPace = "1d"
candleWidth = 0.008
The resampleSize variable is for the time-frame of candlestick. The DataPace variable is how much data overall we're going to consider and show in the graph. Finally, the candleWidth variable is how wide the candlestick will be. The more candlesticks we have, the thinner they need to be so they don't overlap each other, the fewer we have the larger they should be.
Now, we want to add the function to change our time-frame:
def changeTimeFrame(tf):
    global DataPace
    if tf == "7d" and resampleSize == "1Min":
        popupmsg("Too much data chosen, choose a smaller time frame or higher OHLC interval")
    else:
        DataPace = tf
        DatCounter = 9000
Here, we turn DataPace into a global variable for the same reason as before. Next, we have a quick if-statement to check if there will be just way too much data to be reasonable. With 1 week of data, we'd have no reason to show 1 minute bars, as it would be way too much data to even consider (10,080 candles).
As long as there's no problem with the data set choices, we then change the DataPace to the tf parameter.
Next, we need to do our sample size function:
def changeSampleSize(size,width):
    global resampleSize
    global candleWidth
    if DataPace == "7d" and resampleSize == "1Min":
        popupmsg("Too much data chosen, choose a smaller time frame or higher OHLC interval")

    elif DataPace == "tick":
        popupmsg("You're currently viewing tick data, not OHLC.")

    else:
        resampleSize = size
        DatCounter = 9000
        candleWidth = width
Everything you see above follows the same rules as the previous one, with different variables.
Next, in our SeaofBTCapp class:
        dataTF = tk.Menu(menubar, tearoff=1)
        dataTF.add_command(label = "Tick",
                           command=lambda: changeTimeFrame('tick'))
        dataTF.add_command(label = "1 Day",
                           command=lambda: changeTimeFrame('1d'))
        dataTF.add_command(label = "3 Day",
                           command=lambda: changeTimeFrame('3d'))
        dataTF.add_command(label = "1 Week",
                           command=lambda: changeTimeFrame('7d'))
        menubar.add_cascade(label = "Data Time Frame", menu = dataTF)

        OHLCI = tk.Menu(menubar, tearoff=1)
        OHLCI.add_command(label = "Tick",
                           command=lambda: changeTimeFrame('tick'))
        OHLCI.add_command(label = "1 minute",
                           command=lambda: changeSampleSize('1Min', 0.0005))
        OHLCI.add_command(label = "5 minute",
                           command=lambda: changeSampleSize('5Min', 0.003))
        OHLCI.add_command(label = "15 minute",
                           command=lambda: changeSampleSize('15Min', 0.008))
        OHLCI.add_command(label = "30 minute",
                           command=lambda: changeSampleSize('30Min', 0.016))
        OHLCI.add_command(label = "1 Hour",
                           command=lambda: changeSampleSize('1H', 0.032))
        OHLCI.add_command(label = "3 Hour",
                           command=lambda: changeSampleSize('3H', 0.096))

        menubar.add_cascade(label="OHLC Interval", menu=OHLCI)
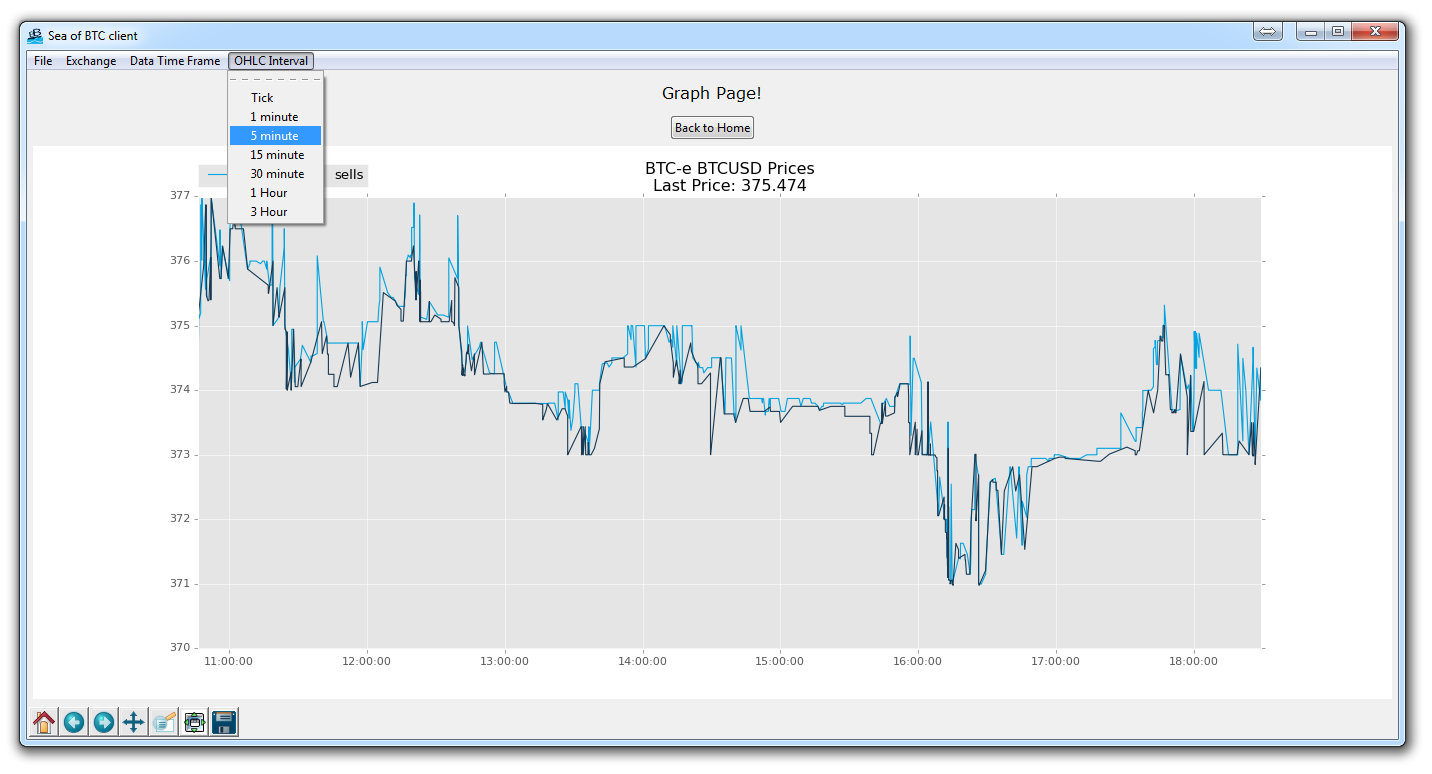
The result will be:
Now our program up to this point looks like:
# The code for changing pages was derived from: http://stackoverflow.com/questions/7546050/switch-between-two-frames-in-tkinter
# License: http://creativecommons.org/licenses/by-sa/3.0/

import matplotlib
matplotlib.use("TkAgg")
from matplotlib.backends.backend_tkagg import FigureCanvasTkAgg, NavigationToolbar2TkAgg
from matplotlib.figure import Figure
import matplotlib.animation as animation
from matplotlib import style

import tkinter as tk
from tkinter import ttk

import urllib
import json

import pandas as pd
import numpy as np

from matplotlib import pyplot as plt


LARGE_FONT= ("Verdana", 12)
NORM_FONT= ("Verdana", 10)
SMALL_FONT= ("Verdana", 8)


style.use("ggplot")

f = Figure()
a = f.add_subplot(111)

exchange = "BTC-e"
DatCounter = 9000
programName = "btce"

resampleSize = "15Min"
DataPace = "1d"
candleWidth = 0.008

def changeTimeFrame(tf):
    global DataPace
    if tf == "7d" and resampleSize == "1Min":
        popupmsg("Too much data chosen, choose a smaller time frame or higher OHLC interval")
    else:
        DataPace = tf
        DatCounter = 9000


def changeSampleSize(size,width):
    global resampleSize
    global candleWidth
    if DataPace == "7d" and resampleSize == "1Min":
        popupmsg("Too much data chosen, choose a smaller time frame or higher OHLC interval")

    elif DataPace == "tick":
        popupmsg("You're currently viewing tick data, not OHLC.")

    else:
        resampleSize = size
        DatCounter = 9000
        candleWidth = width


def changeExchange(toWhat,pn):
    global exchange
    global DatCounter
    global programName

    exchange = toWhat
    programName = pn
    DatCounter = 9000


def popupmsg(msg):
    popup = tk.Tk()
    popup.wm_title("!")
    label = ttk.Label(popup, text=msg, font=NORM_FONT)
    label.pack(side="top", fill="x", pady=10)
    B1 = ttk.Button(popup, text="Okay", command = popup.destroy)
    B1.pack()
    popup.mainloop()


def animate(i):
    dataLink = 'https://btc-e.com/api/3/trades/btc_usd?limit=2000'
    data = urllib.request.urlopen(dataLink)
    data = data.readall().decode("utf-8")
    data = json.loads(data)


    data = data["btc_usd"]
    data = pd.DataFrame(data)

    buys = data[(data['type']=="bid")]
    buys["datestamp"] = np.array(buys["timestamp"]).astype("datetime64[s]")
    buyDates = (buys["datestamp"]).tolist()


    sells = data[(data['type']=="ask")]
    sells["datestamp"] = np.array(sells["timestamp"]).astype("datetime64[s]")
    sellDates = (sells["datestamp"]).tolist()

    a.clear()

    a.plot_date(buyDates, buys["price"], "#00A3E0", label="buys")
    a.plot_date(sellDates, sells["price"], "#183A54", label="sells")

    a.legend(bbox_to_anchor=(0, 1.02, 1, .102), loc=3,
             ncol=2, borderaxespad=0)

    title = "BTC-e BTCUSD Prices\nLast Price: "+str(data["price"][1999])
    a.set_title(title)


class SeaofBTCapp(tk.Tk):

    def __init__(self, *args, **kwargs):

        tk.Tk.__init__(self, *args, **kwargs)

        tk.Tk.iconbitmap(self, default="clienticon.ico")
        tk.Tk.wm_title(self, "Sea of BTC client")


        container = tk.Frame(self)
        container.pack(side="top", fill="both", expand = True)
        container.grid_rowconfigure(0, weight=1)
        container.grid_columnconfigure(0, weight=1)


        menubar = tk.Menu(container)
        filemenu = tk.Menu(menubar, tearoff=0)
        filemenu.add_command(label="Save settings", command = lambda: popupmsg("Not supported just yet!"))
        filemenu.add_separator()
        filemenu.add_command(label="Exit", command=quit)
        menubar.add_cascade(label="File", menu=filemenu)

        exchangeChoice = tk.Menu(menubar, tearoff=1)
        exchangeChoice.add_command(label="BTC-e",
                                   command=lambda: changeExchange("BTC-e","btce"))
        exchangeChoice.add_command(label="Bitfinex",
                                   command=lambda: changeExchange("Bitfinex","bitfinex"))
        exchangeChoice.add_command(label="Bitstamp",
                                   command=lambda: changeExchange("Bitstamp","bitstamp"))
        exchangeChoice.add_command(label="Huobi",
                                   command=lambda: changeExchange("Huobi","huobi"))

        menubar.add_cascade(label="Exchange", menu=exchangeChoice)

        dataTF = tk.Menu(menubar, tearoff=1)
        dataTF.add_command(label = "Tick",
                           command=lambda: changeTimeFrame('tick'))
        dataTF.add_command(label = "1 Day",
                           command=lambda: changeTimeFrame('1d'))
        dataTF.add_command(label = "3 Day",
                           command=lambda: changeTimeFrame('3d'))
        dataTF.add_command(label = "1 Week",
                           command=lambda: changeTimeFrame('7d'))
        menubar.add_cascade(label = "Data Time Frame", menu = dataTF)

        OHLCI = tk.Menu(menubar, tearoff=1)
        OHLCI.add_command(label = "Tick",
                           command=lambda: changeTimeFrame('tick'))
        OHLCI.add_command(label = "1 minute",
                           command=lambda: changeSampleSize('1Min', 0.0005))
        OHLCI.add_command(label = "5 minute",
                           command=lambda: changeSampleSize('5Min', 0.003))
        OHLCI.add_command(label = "15 minute",
                           command=lambda: changeSampleSize('15Min', 0.008))
        OHLCI.add_command(label = "30 minute",
                           command=lambda: changeSampleSize('30Min', 0.016))
        OHLCI.add_command(label = "1 Hour",
                           command=lambda: changeSampleSize('1H', 0.032))
        OHLCI.add_command(label = "3 Hour",
                           command=lambda: changeSampleSize('3H', 0.096))

        menubar.add_cascade(label="OHLC Interval", menu=OHLCI)


        tk.Tk.config(self, menu=menubar)

        self.frames = {}

        for F in (StartPage, BTCe_Page):

            frame = F(container, self)

            self.frames[F] = frame

            frame.grid(row=0, column=0, sticky="nsew")

        self.show_frame(StartPage)

    def show_frame(self, cont):

        frame = self.frames[cont]
        frame.tkraise()


class StartPage(tk.Frame):

    def __init__(self, parent, controller):
        tk.Frame.__init__(self,parent)
        label = tk.Label(self, text=("""ALPHA Bitcoin trading application
        use at your own risk. There is no promise
        of warranty."""), font=LARGE_FONT)
        label.pack(pady=10,padx=10)

        button1 = ttk.Button(self, text="Agree",
                            command=lambda: controller.show_frame(BTCe_Page))
        button1.pack()

        button2 = ttk.Button(self, text="Disagree",
                            command=quit)
        button2.pack()


class PageOne(tk.Frame):

    def __init__(self, parent, controller):
        tk.Frame.__init__(self, parent)
        label = tk.Label(self, text="Page One!!!", font=LARGE_FONT)
        label.pack(pady=10,padx=10)

        button1 = ttk.Button(self, text="Back to Home",
                            command=lambda: controller.show_frame(StartPage))
        button1.pack()


class BTCe_Page(tk.Frame):

    def __init__(self, parent, controller):
        tk.Frame.__init__(self, parent)
        label = tk.Label(self, text="Graph Page!", font=LARGE_FONT)
        label.pack(pady=10,padx=10)

        button1 = ttk.Button(self, text="Back to Home",
                            command=lambda: controller.show_frame(StartPage))
        button1.pack()


        canvas = FigureCanvasTkAgg(f, self)
        canvas.show()
        canvas.get_tk_widget().pack(side=tk.BOTTOM, fill=tk.BOTH, expand=True)

        toolbar = NavigationToolbar2TkAgg(canvas, self)
        toolbar.update()
        canvas._tkcanvas.pack(side=tk.TOP, fill=tk.BOTH, expand=True)


app = SeaofBTCapp()
app.geometry("1280x720")
ani = animation.FuncAnimation(f, animate, interval=5000)
app.mainloop()
-
Programming GUIs and windows with Tkinter and Python Introduction
-
Object Oriented Programming Crash Course with Tkinter
-
Passing functions with Parameters in Tkinter using Lambda
-
How to change and show a new window in Tkinter
-
Styling your GUI a bit using TTK
-
How to embed a Matplotlib graph to your Tkinter GUI
-
How to make the Matplotlib graph live in your application
-
Organizing our GUI
-
Plotting Live Updating Data in Matplotlib and our Tkinter GUI
-
Customizing an embedded Matplotlib Graph in Tkinter
-
Creating our Main Menu in Tkinter
-
Building a pop-up message window
-
Exchange Choice Option
-
Time-frame and sample size option
-
Adding indicator Menus (3 videos)
-
Trading option, start/stop, and help menu options
-
Tutorial on adding a tutorial
-
Allowing the exchange choice option to affect actual shown exchange
-
Adding exchange choice cont'd
-
Adding exchange choices part 3
-
Indicator Support
-
Pulling data from the Sea of BTC API
-
Setting up sub plots within our Tkinter GUI
-
Graphing an OHLC candlestick graph embedded in our Tkinter GUI
-
Acquiring RSI data from Sea of BTC API
-
Acquiring MACD data from Sea of BTC API
-
Converting Tkinter application to .exe and installer with cx_Freeze
