Simple Support Vector Machine (SVM) example with character recognition
In this tutorial video, we cover a very simple example of how machine learning works. My goal here is to show you how simple machine learning can actually be, where the real hard part is actually getting data, labeling data, and organizing the data. To emphasize this, we're going to use a pre-existing data set that everyone has that has come with their installation of Scikit-Learn.
One of the data sets, digits, contains an already structured and labeled set of samples that contains pixel information for numbers up to 9 that we can use for training and testing.
To do this tutorial, you're going to need:
Scikit-learn (sklearn) https://pypi.python.org/pypi/scikit-learn/0.15.2#downloads
requires: http://www.numpy.org/, http://www.scipy.org/
Matplotlib http://matplotlib.org
You can also most likely get by installing with pip. If you have an up-to-date version of Python 2 or Python 3, you have pip, and you should be able to run:
pip install numpy
pip install scipy
pip install matplotlib
pip install scikit-learn
Confused? Don't know what pip is? No problem, watch the installing packages with pip tutorial.
After watching the pip install video, and after trying yourself, if you still can't get it working, contact us using the contact us link in the footer of this page.
Now, to begin:
import matplotlib.pyplot as plt
from sklearn import datasets
from sklearn import svm

digits = datasets.load_digits()
Above, we've imported the necessary modules. Pyplot is used to actually plot a chart, datasets are used as a sample dataset, which contains one set that has number recognition data. Finally, we import svm, which is for the sklearn Support Vector Machine.
Next, we're defining the digits variable, which is the loaded digit dataset.
With this, you can reference the data's features and labels:
print(digits.data)
digits.data is the actual data (features).
print(digits.target)
digits.target is the actual label we've assigned to the digits data.
Now that we've got the data ready, we're ready to do the machine learning. First, we specify the classifier:
If you want, you can just leave parameters blank and use the defaults, like this:
clf = svm.SVC()
Though you will get better results with:
clf = svm.SVC(gamma=0.001, C=100)
This chooses the SVC, and we set gamma and C. For now, we're not going to get into the purpose of these values. They can either be determined by the scientist, or you can use another algorithm to determine the best number to choose based on your data.
It is likely that using the defaults will yield inferior results, though it should still work fairly well in this example.
With that done, now we're ready to train. It's best for clarity to go ahead and assign the value into X (uppercase) and y.
X,y = digits.data[:-10], digits.target[:-10]
This loads in all but the last 10 data points, so we can use all of these for training. Then, we can use the last 10 data points for testing. To alleviate confusion, this X,y pairing is denoted with a capital X, because it is not really a conventional x coordinate. The X contains all of the "coordinates" and y is simply the "target" or "classification" of the data. Each bit of data pertains to a number. So X may contain a bunch of pixel data for the number 5, and the "y" would be 5.
Next we train with:
clf.fit(X,y)
That's it, we've now trained the machine. Let's test it!
print(clf.predict(digits.data[-5]))
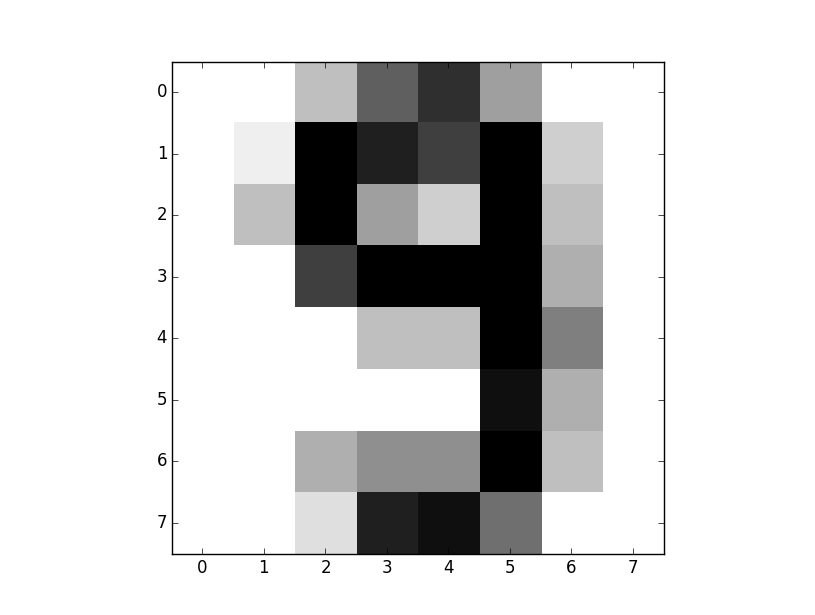
This will predict what the 5th from the last element is. For us, it would be useful to go ahead and visualize this, so we're going to do:
plt.imshow(digits.images[-5], cmap=plt.cm.gray_r, interpolation='nearest')
plt.show()
This just shows us an image of the number in question. Do not worry if you do not follow the imshow function, it is not necessary for this tutorial or this series. If you'd like to learn more about matplotlib specifically, I have tutorials on Matplotlib.
How were the results? Did the machine predict correctly?
My output testing the [-5] example was:
prediction: [9]
The resulting image:
Feel free to play around with the code and test more samples. Adjust gamma a bit. You should notice speed goes up the larger gamma, but accuracy declines. You should notice the opposite if you decrease gamma (do this by factors of 10).
So, something like:
clf = svm.SVC(gamma=0.01, C=100)
This is likely to be inaccurate, or less accurate than before.
clf = svm.SVC(gamma=0.0001, C=100)
The above here is likely to be more accurate, as it is basically "paying more attention to detail."
There exists 1 challenge(s) for this tutorial. for access to these, video downloads, and no ads.
There exists 3 quiz/question(s) for this tutorial. for access to these, video downloads, and no ads.
-
Intro to Machine Learning with Scikit Learn and Python
-
Simple Support Vector Machine (SVM) example with character recognition
-
Our Method and where we will be getting our Data
-
Parsing data
-
More Parsing
-
Structuring data with Pandas
-
Getting more data and meshing data sets
-
Labeling of data part 1
-
Labeling data part 2
-
Finally finishing up the labeling
-
Linear SVC Machine learning SVM example with Python
-
Getting more features from our data
-
Linear SVC machine learning and testing our data
-
Scaling, Normalizing, and machine learning with many features
-
Shuffling our data to solve a learning issue
-
Using Quandl for more data
-
Improving our Analysis with a more accurate measure of performance in relation to fundamentals
-
Learning and Testing our Machine learning algorithm
-
More testing, this time including N/A data
-
Back-testing the strategy
-
Pulling current data from Yahoo
-
Building our New Data-set
-
Searching for investment suggestions
-
Raising investment requirement standards
-
Testing raised standards
-
Streamlining the changing of standards
