Finally finishing up the labeling
With supervised learning, you're going to need to label your data. The idea here is that you can "show" and "teach" the machine some examples of "what is." Then, you can eventually show the machine some data, without the label, expecting it to give you an answer. What we do is feed the data with labels to train the machine. Then we test the machine by feeding information and seeing what the answer is compared to the known answer. If the testing goes well, then we're ready to move forward.
In our case, we're trying to find a pretty vague answer. We cannot possibly expect the machine to be extremely accurate in its choice of successful companies, but we definitely want something over 50%, otherwise it's a bad sign. With investing in mind, not only is accuracy important, but so is the degree by which the companies perform. What if our wrong choices are significantly wrong, and our correct ones only just barely? What if our winning stock picks out perform by 1%, but the incorrect choices we made under-perform by 15%?
Regardless, our next step is labeling. There are many choices for labeling our data. Primarily, we want to label our data as a 0 or a 1, or as under-perform or out-perform.
The next question is according to what? We're going to use the S&P 500 index as comparison. The final question is: according to what time frame? The easiest thing we can do is measure performance according to the "now." This is not really the best choice, and will be changed shortly, but, for now, it's what we will use.
To start, we have similar code as usual:
import pandas as pd
import os
import time
from datetime import datetime
from time import mktime

import matplotlib
import matplotlib.pyplot as plt

from matplotlib import style
style.use('dark_background')

import re
import urllib

path = "X:/Backups/intraQuarter"


def Key_Stats(gather="Total Debt/Equity (mrq)"):

    statspath = path+'/_KeyStats'
    stock_list = [x[0] for x in os.walk(statspath)]
Next we need to add another column to our Data Frame, which we will call "status," which will house the stock's performance.
df = pd.DataFrame(columns = ['Date','Unix','Ticker','DE Ratio','Price','stock_p_change','SP500','sp500_p_change','Difference','Status'])
Then we have no change for the following code:
    ticker_list = []

    sp500_df = pd.DataFrame.from_csv("YAHOO-INDEX_GSPC.csv")


    for each_dir in stock_list[1:]:
        ticker = each_dir.split("\\")[1]
        each_file = os.listdir(each_dir)
        ticker_list.append(ticker)

        starting_stock_value = False
        starting_sp500_value = False

        if len(each_file) > 0:

            for file in each_file:
                #print(file)

                date_stamp = datetime.strptime(file, '%Y%m%d%H%M%S.html')
                unix_time = mktime(date_stamp.timetuple())
                full_file_path = each_dir+'/'+file
                source = open(full_file_path,'r').read()


                try:

                    try:
                        value = float(source.split(gather+':</td><td class="yfnc_tabledata1">')[1].split('</td>')[0])
                    except:
                        value = float(source.split(gather+':</td>\n<td class="yfnc_tabledata1">')[1].split('</td>')[0])

                    try:
                        sp500_date = datetime.fromtimestamp(unix_time).strftime('%Y-%m-%d')
                        row = sp500_df[(sp500_df.index == sp500_date)]
                        sp500_value = float(row['Adjusted Close'])

                    except:
                        sp500_date = datetime.fromtimestamp(unix_time-259200).strftime('%Y-%m-%d')
                        row = sp500_df[(sp500_df.index == sp500_date)]
                        sp500_value = float(row['Adjusted Close'])

                    try:
                        stock_price = float(source.split('</small><big><b>')[1].split('</b></big>')[0])
                    except:

                        try:
                            stock_price = (source.split('</small><big><b>')[1].split('</b></big>')[0])
                            #print(stock_price)

                            stock_price = re.search(r'(\d{1,8}\.\d{1,8})', stock_price)

                            stock_price = float(stock_price.group(1))
                            #print(stock_price)


                        except:

                            try:
                                stock_price = (source.split('<span class="time_rtq_ticker">')[1].split('</span>')[0])
                                #print(stock_price)

                                stock_price = re.search(r'(\d{1,8}\.\d{1,8})', stock_price)

                                stock_price = float(stock_price.group(1))
                                #print(stock_price)

                            except:

                                print('wtf stock price lol',ticker,file, value)
                                time.sleep(5)

                    if not starting_stock_value:
                        starting_stock_value = stock_price

                    if not starting_sp500_value:
                        starting_sp500_value = sp500_value


                    stock_p_change = ((stock_price - starting_stock_value) / starting_stock_value) * 100
                    sp500_p_change = ((sp500_value - starting_sp500_value) / starting_sp500_value) * 100

                    location = len(df['Date'])
Now is where we account for the difference between the S&P 500 and the stock:
                    difference = stock_p_change-sp500_p_change
                    if difference > 0:
                        status = "outperform"
                    else:
                        status = "underperform"
Now we finish our script, not forgetting to add the new column to our appending row:
df = df.append({'Date':date_stamp,
'Unix':unix_time,
'Ticker':ticker,
'DE Ratio':value,
'Price':stock_price,
'stock_p_change':stock_p_change,
'SP500':sp500_value,
'sp500_p_change':sp500_p_change,
############################
'Difference':difference,
'Status':status},
ignore_index=True)
except Exception as e:
pass
#print(ticker,e,file, value)
#print(ticker_list)
#print(df)
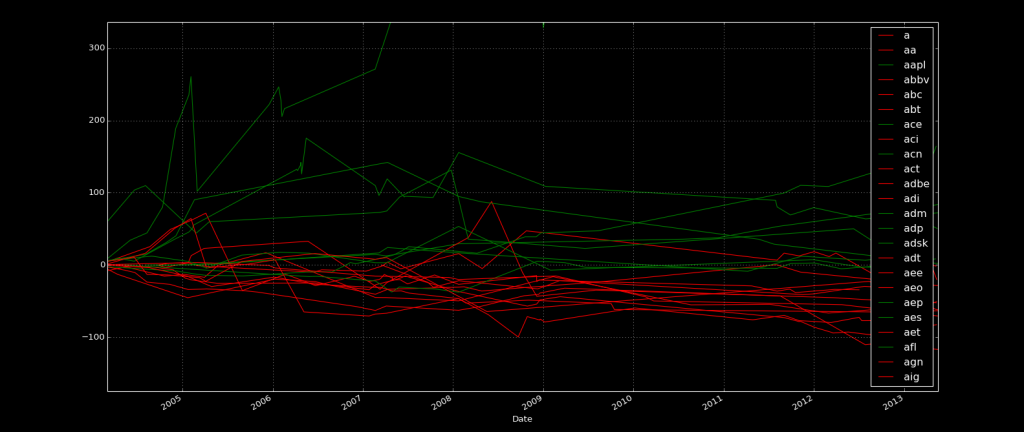
for each_ticker in ticker_list:
try:
plot_df = df[(df['Ticker'] == each_ticker)]
plot_df = plot_df.set_index(['Date'])
if plot_df['Status'][-1] == 'underperform':
color = 'r'
else:
color = 'g'
plot_df['Difference'].plot(label=each_ticker, color=color)
plt.legend()
except Exception as e:
print(str(e))
plt.show()
save = gather.replace(' ','').replace(')','').replace('(','').replace('/','')+str('.csv')
print(save)
df.to_csv(save)
Key_Stats()
-
Intro to Machine Learning with Scikit Learn and Python
-
Simple Support Vector Machine (SVM) example with character recognition
-
Our Method and where we will be getting our Data
-
Parsing data
-
More Parsing
-
Structuring data with Pandas
-
Getting more data and meshing data sets
-
Labeling of data part 1
-
Labeling data part 2
-
Finally finishing up the labeling
-
Linear SVC Machine learning SVM example with Python
-
Getting more features from our data
-
Linear SVC machine learning and testing our data
-
Scaling, Normalizing, and machine learning with many features
-
Shuffling our data to solve a learning issue
-
Using Quandl for more data
-
Improving our Analysis with a more accurate measure of performance in relation to fundamentals
-
Learning and Testing our Machine learning algorithm
-
More testing, this time including N/A data
-
Back-testing the strategy
-
Pulling current data from Yahoo
-
Building our New Data-set
-
Searching for investment suggestions
-
Raising investment requirement standards
-
Testing raised standards
-
Streamlining the changing of standards
