Labeling data part 2
With machine learning, everything tends to boil down to features and labels. We have labels, like, in our case, under-performer, and out-performer. With those labels, we have "features" that are the specific values like Debt/Equity ratio that correspond to that label.
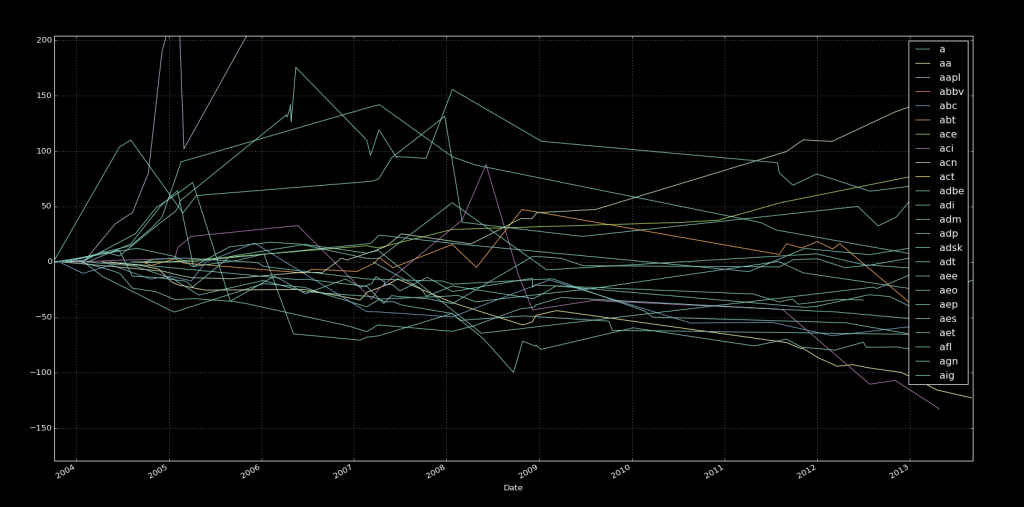
With that, we're looking to now label our data. To do that, we're going to compare the stock's percentage change to the S&P 500's percentage change. If the stock's percent change is less than the S&P 500, then the stock is and under-performing stock. If the percentage change is more, than the label is out-perform.
To do this, we need the calculate percentage change and compare them. Let's cover that:
import pandas as pd
import os
import time
from datetime import datetime

path = "X:/Backups/intraQuarter"

def Key_Stats(gather="Total Debt/Equity (mrq)"):
    statspath = path+'/_KeyStats'
    stock_list = [x[0] for x in os.walk(statspath)]
    df = pd.DataFrame(columns = ['Date',
                                 'Unix',
                                 'Ticker',
                                 'DE Ratio',
                                 'Price',
                                 'stock_p_change',
                                 'SP500',
                                 'sp500_p_change'])
Notice the new changes to our Data Frame.
Next:
    sp500_df = pd.DataFrame.from_csv("YAHOO-INDEX_GSPC.csv")

    ticker_list = []

    for each_dir in stock_list[1:25]:
        each_file = os.listdir(each_dir)
        ticker = each_dir.split("\\")[1]
        ticker_list.append(ticker)

        starting_stock_value = False
        starting_sp500_value = False
Notice the starting_stock_value and the matching sp500 version. The reason for this is that, as we go, we want to calculate % change. That said, we need to start over with the % change each time the stock itself changes. To handle for this, we set these values.
Next:
        if len(each_file) > 0:
            for file in each_file:
                date_stamp = datetime.strptime(file, '%Y%m%d%H%M%S.html')
                unix_time = time.mktime(date_stamp.timetuple())
                full_file_path = each_dir+'/'+file
                source = open(full_file_path,'r').read()
                try:
                    value = float(source.split(gather+':</td><td class="yfnc_tabledata1">')[1].split('</td>')[0])

                    try:
                        sp500_date = datetime.fromtimestamp(unix_time).strftime('%Y-%m-%d')
                        row = sp500_df[(sp500_df.index == sp500_date)]
                        sp500_value = float(row["Adjusted Close"])
                    except:
                        sp500_date = datetime.fromtimestamp(unix_time-259200).strftime('%Y-%m-%d')
                        row = sp500_df[(sp500_df.index == sp500_date)]
                        sp500_value = float(row["Adjusted Close"])


                    stock_price = float(source.split('</small><big><b>')[1].split('</b></big>')[0])
                    #print("stock_price:",stock_price,"ticker:", ticker)

                    if not starting_stock_value:
                        starting_stock_value = stock_price
                    if not starting_sp500_value:
                        starting_sp500_value = sp500_value
So now we set the starting value if we don't have one. From here, we then just need to calculate % change (new-old)/old * 100:
                    stock_p_change = ((stock_price - starting_stock_value) / starting_stock_value) * 100
                    sp500_p_change = ((sp500_value - starting_sp500_value) / starting_sp500_value) * 100
Now we just round off the script with the previously covered code:
                    df = df.append({'Date':date_stamp,
                                    'Unix':unix_time,
                                    'Ticker':ticker,
                                    'DE Ratio':value,
                                    'Price':stock_price,
                                    'stock_p_change':stock_p_change,
                                    'SP500':sp500_value,
                                    'sp500_p_change':sp500_p_change}, ignore_index = True)
                except Exception as e:
                    pass
                    #print(str(e))

    save = gather.replace(' ','').replace(')','').replace('(','').replace('/','')+('.csv')
    print(save)
    df.to_csv(save)

Key_Stats()
There exists 1 quiz/question(s) for this tutorial. for access to these, video downloads, and no ads.
-
Intro to Machine Learning with Scikit Learn and Python
-
Simple Support Vector Machine (SVM) example with character recognition
-
Our Method and where we will be getting our Data
-
Parsing data
-
More Parsing
-
Structuring data with Pandas
-
Getting more data and meshing data sets
-
Labeling of data part 1
-
Labeling data part 2
-
Finally finishing up the labeling
-
Linear SVC Machine learning SVM example with Python
-
Getting more features from our data
-
Linear SVC machine learning and testing our data
-
Scaling, Normalizing, and machine learning with many features
-
Shuffling our data to solve a learning issue
-
Using Quandl for more data
-
Improving our Analysis with a more accurate measure of performance in relation to fundamentals
-
Learning and Testing our Machine learning algorithm
-
More testing, this time including N/A data
-
Back-testing the strategy
-
Pulling current data from Yahoo
-
Building our New Data-set
-
Searching for investment suggestions
-
Raising investment requirement standards
-
Testing raised standards
-
Streamlining the changing of standards
