Testing trading strategies with Quantopian Introduction - Python Programming for Finance p.13
Hello and welcome to part 13 of the Python for Finance tutorial series. In this tutorial, we're going to begin talking about strategy back-testing. The field of back testing, and the requirements to do it right are pretty massive. Basically, what's required for us is to create a system that will take historical pricing data and simulate trading in that environment, and then gives us the results. That might sound simple, but, in order to analyze the strategy, we need to be tracking a bunch of metrics like what we sold, when, how often we trade, what our Beta and Alpha is, along with other metrics like drawdown, Sharpe Ratio, Volatility, leverage, and a bunch more. Along with that, we generally want to be able to visualize all of this. So, we can either write all of this ourselves, or we can use a platform to help us with that...
...Which is why we're going to be introducing Quantopian, which is a platform that allows us to write and back-test Python-powered trading strategies very easily.
What Quantopian does is it adds a GUI layer on top of the Zipline back testing library for Python, along with a bunch of data sources as well, many of which are completely free to work with. You can also get capital allocations from Quantopian by licensing your strategy to them if you meet certain criteria. Generally, a beta between -0.3 and +0.3 is a good starting point, but you also need to have other healthy metrics to compete. More on this later, let's learn about the basics of Quantopian first. Since Quantopian is powered by primarily open sourced libraries like Zipline, Alphalens, and Pyfolio, you can also run a Quantopian-like platform locally if you like. I find most people who are interested in running locally are interested in this to keep their algorithms private. Quantopian does not view your algorithms unless you give them permission to, and the community only sees your algorithms if you share them. I highly encourage you to view your relationship with Quantopian not as an adversarial one, but instead as a partnership. If you come up with something of high quality, Quantopian is very interested in working with, and has the funding to invest in, you. In this relationship, Quantopian is bringing the platform, funding, and other experts in the field to help you, it's a pretty good deal in my opinion.
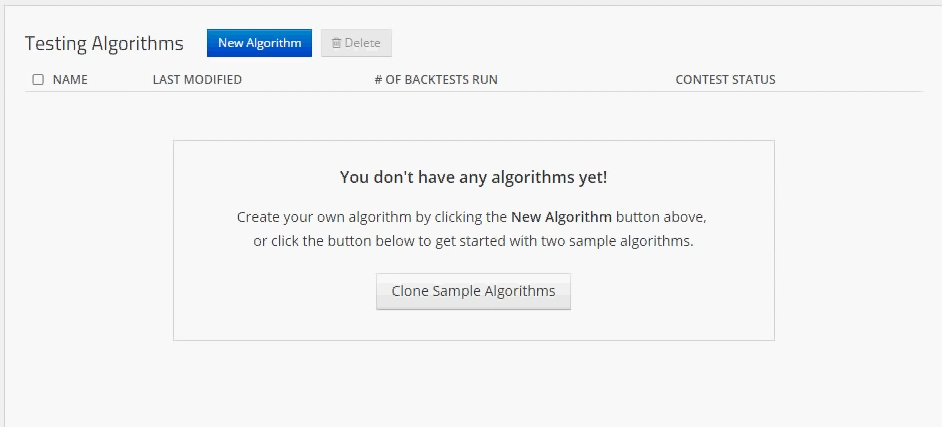
To begin, head to Quantopian.com, create an account if you don't have one, and sign in. Feel free to poke around a bit. The Quantopian community forums are a great place to absorb some knowledge. Quantopian also runs a frequent contest for cash prices. We're going to start with algorithms. Once there, choose the blue "new algorithm" button. For now, we're going to be spending most of our time in two places, which can be found under the "My Code" button. To start, we'll head to algorithms, and create a new algorithm using the blue "New Algorithm" button.
When you create the algorithm, you should be taken to your active-editing algorithms page with the cloned algorithm, which looks like this (minus the colored boxes), and a few changes possibly to the UI.
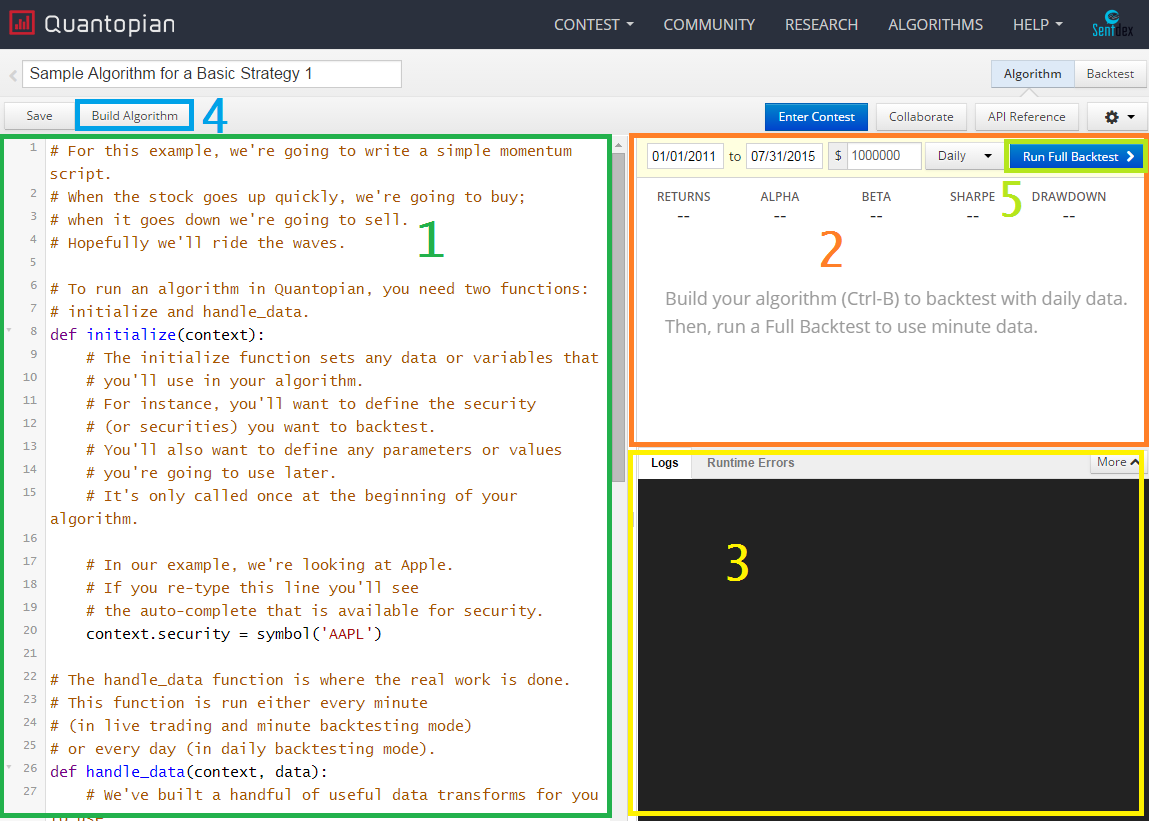
- Python Editor - This is where you code your Python logic for the algoirthm.
- Built-algorithm results - When you build the algorithm, graphical results will apppear here.
- Log / Error output - Any console output / log information will come here. It's common to have your program output various bits of text for debugging or just for more information.
- Build Algorithm - Use this to quickly test what you've written. Results wont be saved, but you can see the result in the built-algorithm results section.
- Full Backtest - This will run a full back test based on your current algorithm. Full back tests come with a bit more analysis, results are saved, and the algorithm that generated those results is also saved, so you can go back through back tests and view the exact code that generated a specific result.
The starting sample code is something like:
"""
This is a template algorithm on Quantopian for you to adapt and fill in.
"""
from quantopian.algorithm import attach_pipeline, pipeline_output
from quantopian.pipeline import Pipeline
from quantopian.pipeline.data.builtin import USEquityPricing
from quantopian.pipeline.factors import AverageDollarVolume

def initialize(context):
    """
    Called once at the start of the algorithm.
    """
    # Rebalance every day, 1 hour after market open.
    schedule_function(my_rebalance, date_rules.every_day(), time_rules.market_open(hours=1))

    # Record tracking variables at the end of each day.
    schedule_function(my_record_vars, date_rules.every_day(), time_rules.market_close())

    # Create our dynamic stock selector.
    attach_pipeline(make_pipeline(), 'my_pipeline')

def make_pipeline():
    """
    A function to create our dynamic stock selector (pipeline). Documentation on
    pipeline can be found here: https://www.quantopian.com/help#pipeline-title
    """


    # Create a dollar volume factor.
    dollar_volume = AverageDollarVolume(window_length=1)

    # Pick the top 1% of stocks ranked by dollar volume.
    high_dollar_volume = dollar_volume.percentile_between(99, 100)

    pipe = Pipeline(
        screen = high_dollar_volume,
        columns = {
            'dollar_volume': dollar_volume
        }
    )
    return pipe

def before_trading_start(context, data):
    """
    Called every day before market open.
    """
    context.output = pipeline_output('my_pipeline')

    # These are the securities that we are interested in trading each day.
    context.security_list = context.output.index

def my_assign_weights(context, data):
    """
    Assign weights to securities that we want to order.
    """
    pass

def my_rebalance(context,data):
    """
    Execute orders according to our schedule_function() timing.
    """
    pass

def my_record_vars(context, data):
    """
    Plot variables at the end of each day.
    """
    pass

def handle_data(context,data):
    """
    Called every minute.
    """
    pass
Which is great, but maybe a bit much to start with. Quantopian also provides some example algorithms if your account is new. Feel free to check those out, but you might find them to be confusing. The only two functions you need in every algorithm are: initialize and handle_data. The initialize function runs once, at the beginning of your script. You will use this to setup globals like rules, functions to use later, and various parameters. Next, the handle_data function that runs every minute against market data.
Let's write our own simple strategy to get comfortable with Quantopian. We're going to implement a simple moving average crossover strategy, and see how that does.
If you're not familiar with moving averages, what they do is take a certain number of "windows" of data. In the case of running against daily prices, one window would be one day. If you took a 20 moving average, this would mean a 20 day moving average. From here, the idea is let's say you have a 20 moving average and a 50 moving average. Plotting this on a graph might look something like:
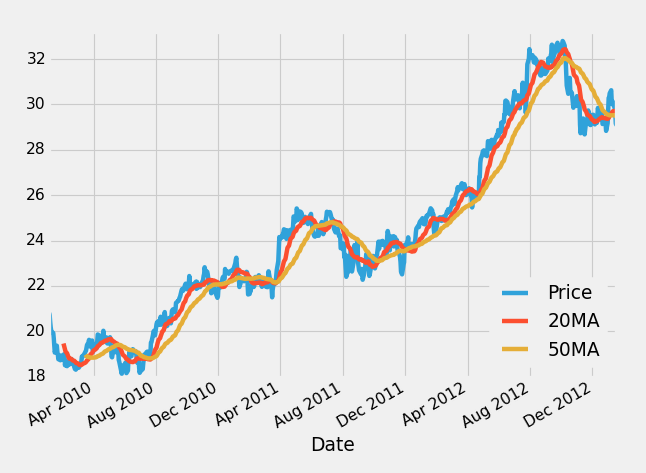
Here, the blue line is the stock price, the red line is the 20 moving average and the yellow line is the 50 moving average. The idea is that when the 20 moving average, which reacts faster, moves above the 50 moving average, it means the price might be trending up, and we may want to invest. Conversely, if the 20 moving average falls below the 50 moving average, this signals maybe that the price is trending down, and that we might want to either sell or investment or even short sell the company, which is where you bet against it.
For our purposes here, let's apply a moving average crossover strategy to Apple (AAPL), between the dates of October 7th 2015 and October 7th 2016. For this period, AAPL shares have gone down, and then up, with very little overall net change. Our crossover strategy should hopefully stay away or short (bet against) as the price falls, and then jump on when price is rising. Shorting a company entails borrowing shares from someone else, selling them, then rebuying the shares at a later date. Your hope is that the price of the shares falls, and you re-buy them back much cheaper, and give the original owner back their shares, pocketing the difference. To begin, let's build the initialize method:
def initialize(context):
    context.aapl = sid(24)
For now, we're just going to define our Apple stock. If you actually begin to type out sid(, Quantopian has a nice auto completion functionality where you can begin to either type the company's name or ticker symbol to find their sid. The reason for using sid is because company tickers can change over periods of time. This is one way to ensure that you're getting the ticker you're actually intending to get. You can also use symbol() to use the ticker, and make your code a bit more easy to read, but this is not recommended, since the ticker can change.
Every time you create an algorithm with Zipline or Quantopian, you will need to have the initialize and handle_data methods.
The initialize method runs once upon the starting of the algorithm (or once a day if you are running the algorithm live in real time). Handle_data runs once per minute period.
Within our initialize method, we pass this context parameter. Context is a Python Dictionary, which is what we'll use to track what we might otherwise use global variables for. Put simply, the context variable is used to track our current investment situation, with things like our portfolio and cash.
Next, we still need our handle_data function. This function takes both context and data as parameters.
The context parameter has already been explained, and the data variable is used to track the environment outside of our actual portfolio. This tracks things like stock prices and other information about companies that we may be invested in, or not, but they're companies we're tracking.
To begin the handle_data function:
def handle_data(context,data):
    # prices for aapl for the last 50 days, in 1 day intervals
    hist = data.history(context.aapl,'price', 50, '1d')
We can use the .history method to grab historical prices for Apple, for the last 50 days, in 1 day intervals. Now we can do:
    # mean of the entire 200 day history
    sma_50 = hist.mean()
    # mean of just the last 50 days
    sma_20 = hist[-20:].mean()
The sma_50 value is just whatever the average/mean is for the history data we just pulled. The sma_20 is the last 20 days of data. Note that this is contained within the handle_data method, which runs for every period, so that's all we have to do to track the daily values for the 50 and 20 simple moving averages.
In the next tutorial, we're going to talk about making orders.
-
Intro and Getting Stock Price Data - Python Programming for Finance p.1
-
Handling Data and Graphing - Python Programming for Finance p.2
-
Basic stock data Manipulation - Python Programming for Finance p.3
-
More stock manipulations - Python Programming for Finance p.4
-
Automating getting the S&P 500 list - Python Programming for Finance p.5
-
Getting all company pricing data in the S&P 500 - Python Programming for Finance p.6
-
Combining all S&P 500 company prices into one DataFrame - Python Programming for Finance p.7
-
Creating massive S&P 500 company correlation table for Relationships - Python Programming for Finance p.8
-
Preprocessing data to prepare for Machine Learning with stock data - Python Programming for Finance p.9
-
Creating targets for machine learning labels - Python Programming for Finance p.10 and 11
-
Machine learning against S&P 500 company prices - Python Programming for Finance p.12
-
Testing trading strategies with Quantopian Introduction - Python Programming for Finance p.13
-
Placing a trade order with Quantopian - Python Programming for Finance p.14
-
Scheduling a function on Quantopian - Python Programming for Finance p.15
-
Quantopian Research Introduction - Python Programming for Finance p.16
-
Quantopian Pipeline - Python Programming for Finance p.17
-
Alphalens on Quantopian - Python Programming for Finance p.18
-
Back testing our Alpha Factor on Quantopian - Python Programming for Finance p.19
-
Analyzing Quantopian strategy back test results with Pyfolio - Python Programming for Finance p.20
-
Strategizing - Python Programming for Finance p.21
-
Finding more Alpha Factors - Python Programming for Finance p.22
-
Combining Alpha Factors - Python Programming for Finance p.23
-
Portfolio Optimization - Python Programming for Finance p.24
-
Zipline Local Installation for backtesting - Python Programming for Finance p.25
-
Zipline backtest visualization - Python Programming for Finance p.26
-
Custom Data with Zipline Local - Python Programming for Finance p.27
-
Custom Markets Trading Calendar with Zipline (Bitcoin/cryptocurrency example) - Python Programming for Finance p.28
