Handling Data and Graphing - Python Programming for Finance p.2
Hello and welcome to part 2 of the Python for Finance tutorial series. In this tutorial, we're going to further break down some basic data manipulation and visualizations with our stock data. The starting code that we're going to be using (which was covered in the previous tutorial) is:
import datetime as dt
import matplotlib.pyplot as plt
from matplotlib import style
import pandas as pd
import pandas_datareader.data as web

style.use('ggplot')

start = dt.datetime(2015, 1, 1)
end = dt.datetime.now()
df = web.DataReader("TSLA", 'morningstar', start, end)
df.reset_index(inplace=True)
df.set_index("Date", inplace=True)
df = df.drop("Symbol", axis=1)
What are some things we can do with these DataFrames? For one, we can save them easily to a variety of datatypes. One option is a csv:
df.to_csv('TSLA.csv')
Rather than reading data from Yahoo's finance API to a DataFrame, we can also read data from a CSV file into a DataFrame:
df = pd.read_csv('tsla.csv', parse_dates=True, index_col=0)
Now, we can graph with:
df.plot()
plt.show()
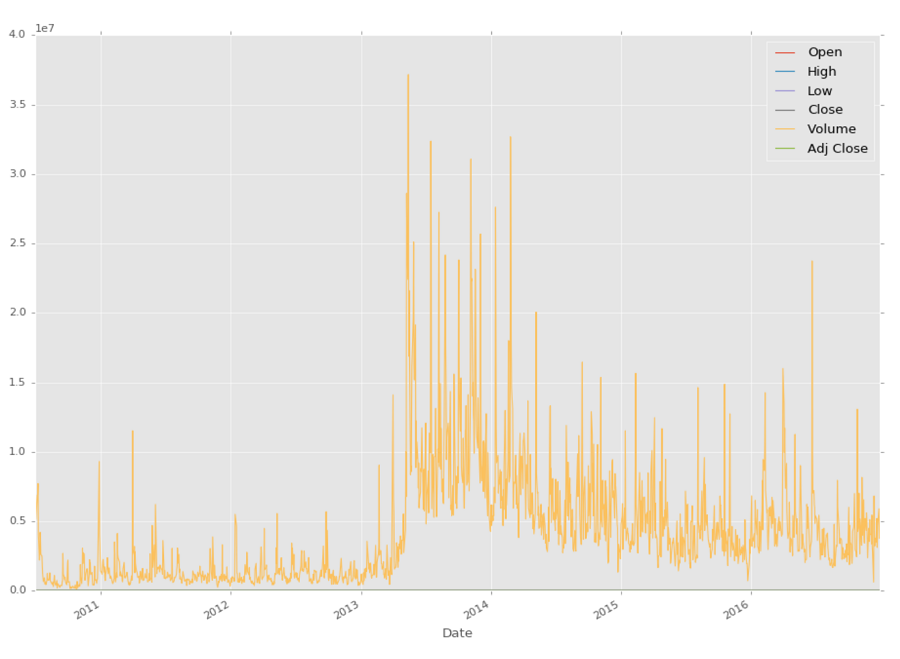
Cool, except that the only thing we can really see here is the volume, since it's on a scale MUCH larger than stock price. How can we maybe just graph what we're interested in?
df['Adj Close'].plot()
plt.show()
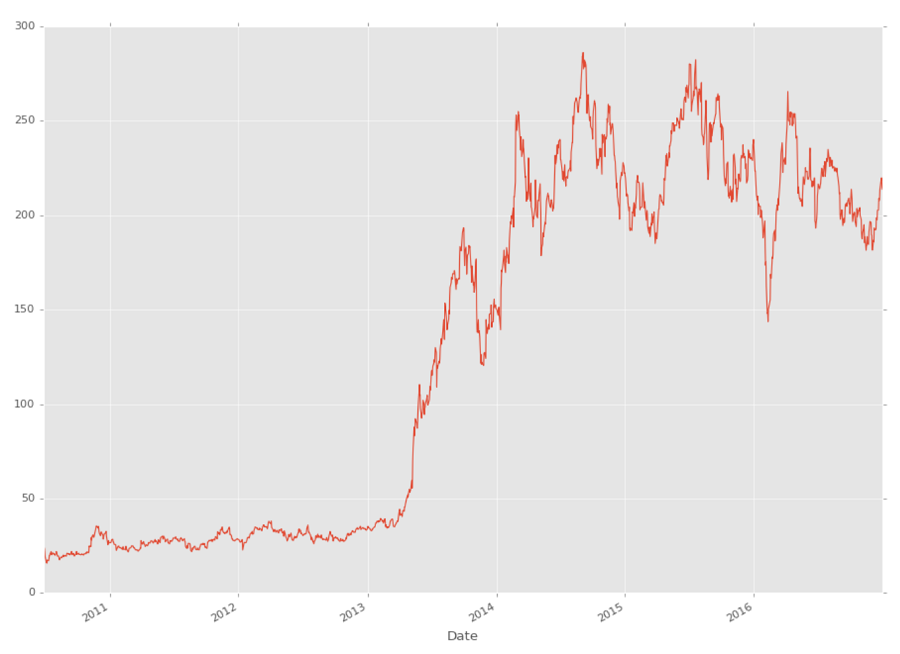
As you can see, you can reference specific columns in the DataFrame like: df['Adj Close'], but you can also reference multiple at a time, like so:
df[['High','Low']]
In the next tutorial, we're going to cover some basic manipulations of this data, along with some more basic visualizations.
-
Intro and Getting Stock Price Data - Python Programming for Finance p.1
-
Handling Data and Graphing - Python Programming for Finance p.2
-
Basic stock data Manipulation - Python Programming for Finance p.3
-
More stock manipulations - Python Programming for Finance p.4
-
Automating getting the S&P 500 list - Python Programming for Finance p.5
-
Getting all company pricing data in the S&P 500 - Python Programming for Finance p.6
-
Combining all S&P 500 company prices into one DataFrame - Python Programming for Finance p.7
-
Creating massive S&P 500 company correlation table for Relationships - Python Programming for Finance p.8
-
Preprocessing data to prepare for Machine Learning with stock data - Python Programming for Finance p.9
-
Creating targets for machine learning labels - Python Programming for Finance p.10 and 11
-
Machine learning against S&P 500 company prices - Python Programming for Finance p.12
-
Testing trading strategies with Quantopian Introduction - Python Programming for Finance p.13
-
Placing a trade order with Quantopian - Python Programming for Finance p.14
-
Scheduling a function on Quantopian - Python Programming for Finance p.15
-
Quantopian Research Introduction - Python Programming for Finance p.16
-
Quantopian Pipeline - Python Programming for Finance p.17
-
Alphalens on Quantopian - Python Programming for Finance p.18
-
Back testing our Alpha Factor on Quantopian - Python Programming for Finance p.19
-
Analyzing Quantopian strategy back test results with Pyfolio - Python Programming for Finance p.20
-
Strategizing - Python Programming for Finance p.21
-
Finding more Alpha Factors - Python Programming for Finance p.22
-
Combining Alpha Factors - Python Programming for Finance p.23
-
Portfolio Optimization - Python Programming for Finance p.24
-
Zipline Local Installation for backtesting - Python Programming for Finance p.25
-
Zipline backtest visualization - Python Programming for Finance p.26
-
Custom Data with Zipline Local - Python Programming for Finance p.27
-
Custom Markets Trading Calendar with Zipline (Bitcoin/cryptocurrency example) - Python Programming for Finance p.28
