Quantopian Fetcher - Python for Finance with Zipline and Quantopian 9
Algorithmic trading with Python and Sentiment Analysis Tutorial
While you may sometimes be able to create an algorithm that deals purely with basic data like prices, more advanced algorithms tend to also draw from information that may come from another source than the market. For example, in this tutorial, we're going to use stock sentiment analysis data from Sentdex.com, which is a website that tracks sentiment analysis on stocks, politics, and more. An example of the visual representation of stock price to sentiment is:
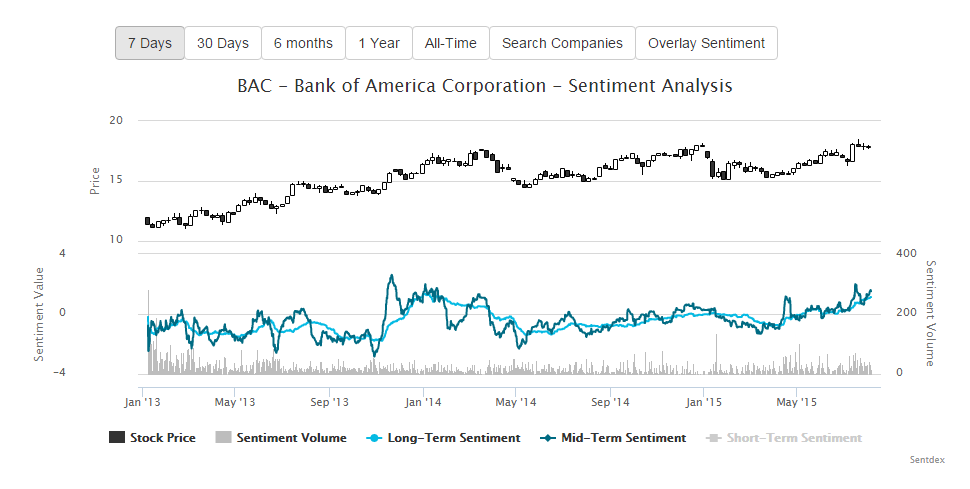
Visually looking at the graph, we can see some places where it looks like we could make some great trades, others maybe we're not sure. Bottom line, we need to test it, rather than rely on our likely biases. Since I wrote Sentdex, I probably have a lot of bias!
Since we've been using the Quantopian service up til now, which combines Python and Zipline into a nice web-based app, we'd like to continue using them. The only problem is Quantopian doesn't currently incorporate Sentdex data! Luckily, Quantopian has thought about this, and they have built in a method called fetch_csv. This method allows us to call upon a CSV-like file that is hosted online to collect the data.
If we head to the Sentdex API, we can find a sample of the entire database, as well as a sample of a couple years of sentiment signal data that we can directly incorporate into our algorithm. This sample dump is updated once in a while, since it is free and there's a paid API if you want constant updates.
There are a few ways to consume the sentiment signals, but the free sample comes with daily sentiment signal means, updated 30 minutes prior to market open for each day. This sample file is the entirety of data available from Sentdex, which started in October 2012.
Example output from the sample:
2015-06-15 13:00:00,MS,-1
2015-06-15 13:00:00,JPM,1
2015-06-15 13:00:00,UPS,6
2015-06-15 13:00:00,CCL,6
2015-06-15 13:00:00,IRM,1
2015-06-15 13:00:00,CI,-1
2015-06-15 13:00:00,EIX,-3
2015-06-15 13:00:00,GTN,-1
2015-06-15 13:00:00,ACN,4
2015-06-15 13:00:00,HD,5
2015-06-15 13:00:00,BMY,4
2015-06-15 13:00:00,CAB,5
2015-06-15 13:00:00,XOM,-1
2015-06-15 13:00:00,FTR,4
2015-06-15 13:00:00,TSS,1
If the company was not updated at all that day, then there is no report in the sample. If it was, then the reported sentiment signal is a 24 hour mean of updates, which again is calculated 30 minutes before the markets open.
What the signals mean:
Sentiment signals:
- 6 - Strongest positive sentiment.
- 5 - Extremely strong, positive, sentiment.
- 4 - Very strong, positive, sentiment.
- 3 - Strong, positive sentiment.
- 2 - Substantially positive sentiment.
- 1 - Barely positive sentiment.
- 0 - Neutral sentiment
- -1 - Sentiment trending into negatives.
- -2 - Weak negative sentiment.
- -3 - Strongly negative sentiment.
With this data, we're curious what we can see by investing solely on sentiment data. To start, we write our initialize method:
def initialize(context):
    context.investment_size = (context.portfolio.cash / 10.0)
    context.stop_loss_pct = 0.995
    set_symbol_lookup_date('2012-10-01')
    fetch_csv('http://sentdex.com/api/finance/sentiment-signals/sample/', pre_func = preview)
First, context.investment_size dictates the size of the investment in any company that we want to make. Basically, we're interested in having 10 positions at any time. Next, we save a stop-loss percent, if we want to add stop loss. Next, we'll use a new method called set_symbol_lookup_date, which is used to set what date we're using for the symbols. Symbols change over time, companies come and go, so we'll set this to the starting time of Sentdex's data. Finally, we use fetch_csv to grab the Sentdex API sentiment signals sample. One of the parameters here is called pre_func. There's a pre function and a post function, which you can run on the data. For now, we can just run a pre_func that will be just a preview of the data, something like:
def preview(df):
    log.info(df.head())
    return df
Full code up to now is:
def preview(df):
    log.info(df.head())
    return df

def initialize(context):
    context.investment_size = (context.portfolio.cash / 10.0)
    context.stop_loss_pct = 0.995
    set_symbol_lookup_date('2012-10-01')
    fetch_csv('http://sentdex.com/api/finance/sentiment-signals/sample/', pre_func = preview)

# Will be called on every trade event for the securities you specify.
def handle_data(context, data):
    pass
Once this is done, you should run the code to make sure the dataframe's head is output to the log. Not familiar with DataFrames? Check out the Pandas tutorials! Otherwise, continue along to the next tutorial.
-
Programming for Finance with Python, Zipline and Quantopian
-
Programming for Finance Part 2 - Creating an automated trading strategy
-
Programming for Finance Part 3 - Back Testing Strategy
-
Accessing Fundamental company Data - Programming for Finance with Python - Part 4
-
Back-testing our strategy - Programming for Finance with Python - part 5
-
Strategy Sell Logic with Schedule Function with Quantopian - Python for Finance 6
-
Stop-Loss in our trading strategy - Python for Finance with Quantopian and Zipline 7
-
Achieving Targets - Python for Finance with Zipline and Quantopian 8
-
Quantopian Fetcher - Python for Finance with Zipline and Quantopian 9
-
Trading Logic with Sentiment Analysis Signals - Python for Finance 10
-
Shorting based on Sentiment Analysis signals - Python for Finance 11
-
Paper Trading a Strategy on Quantopian - Python for Finance 12
-
Understanding Hedgefund and other financial Objectives - Python for Finance 13
-
Building Machine Learning Framework - Python for Finance 14
-
Creating Machine Learning Classifier Feature Sets - Python for Finance 15
-
Creating our Machine Learning Classifiers - Python for Finance 16
-
Testing our Machine Learning Strategy - Python for Finance 17
-
Understanding Leverage - Python for Finance 18
-
Quantopian Pipeline Tutorial Introduction
-
Simple Quantopian Pipeline Strategy
