Geographical Plotting with Basemap and Python p. 5
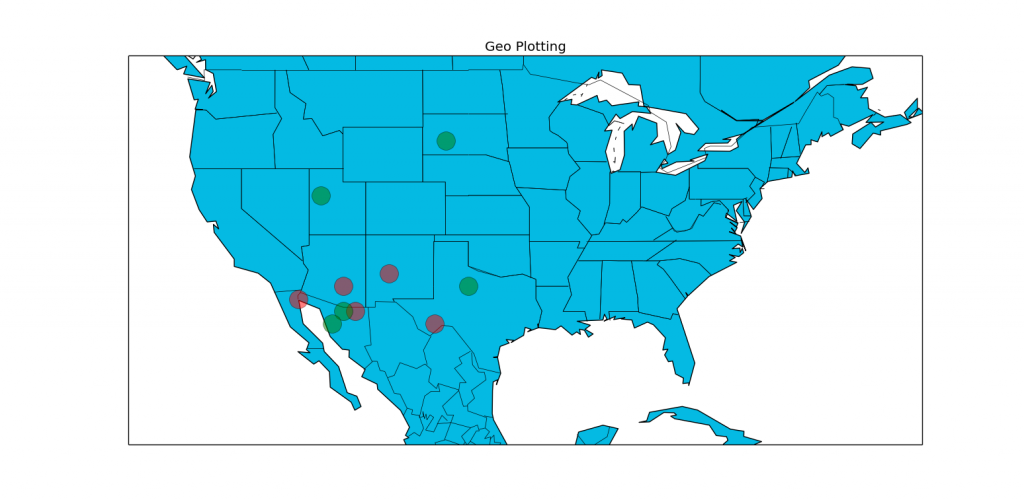
In this Python programming tutorial with Matplotlib and Basemap we cover how to adjust the marker size and the alpha of our coordinate plots. Below is the sample code from the video tutorial:
from mpl_toolkits.basemap import Basemap
import matplotlib.pyplot as plt

m = Basemap(projection='mill',llcrnrlat=20,urcrnrlat=50,\
            llcrnrlon=-130,urcrnrlon=-60,resolution='c')
m.drawcoastlines()
m.drawcountries()
m.drawstates()
m.fillcontinents(color='#04BAE3', lake_color='#FFFFFF')
m.drawmapboundary(fill_color='#FFFFFF')

lat = 30,31,34,33,32
lon = -103,-110,-107,-111,-115


lat2 = 40,33,44,31,30
lon2 = -113,-100,-102,-111,-112

x,y = m(lon,lat)
m.plot(x,y,'ro',markersize=20,alpha=.5)

x,y = m(lon2,lat2)
m.plot(x,y,'go',markersize=20,alpha=.5)

plt.title('Geo Plotting')
plt.show()
-
Matplotlib Crash Course
-
3D graphs in Matplotlib
-
3D Scatter Plot with Python and Matplotlib
-
More 3D scatter-plotting with custom colors
-
3D Barcharts
-
3D Plane wireframe Graph
-
Live Updating Graphs with Matplotlib Tutorial
-
Modify Data Granularity for Graphing Data
-
Geographical Plotting with Basemap and Python p. 1
-
Geographical Plotting with Basemap and Python p. 2
-
Geographical Plotting with Basemap and Python p. 3
-
Geographical Plotting with Basemap and Python p. 4
-
Geographical Plotting with Basemap and Python p. 5
-
Advanced Matplotlib Series (videos and ending source only)
