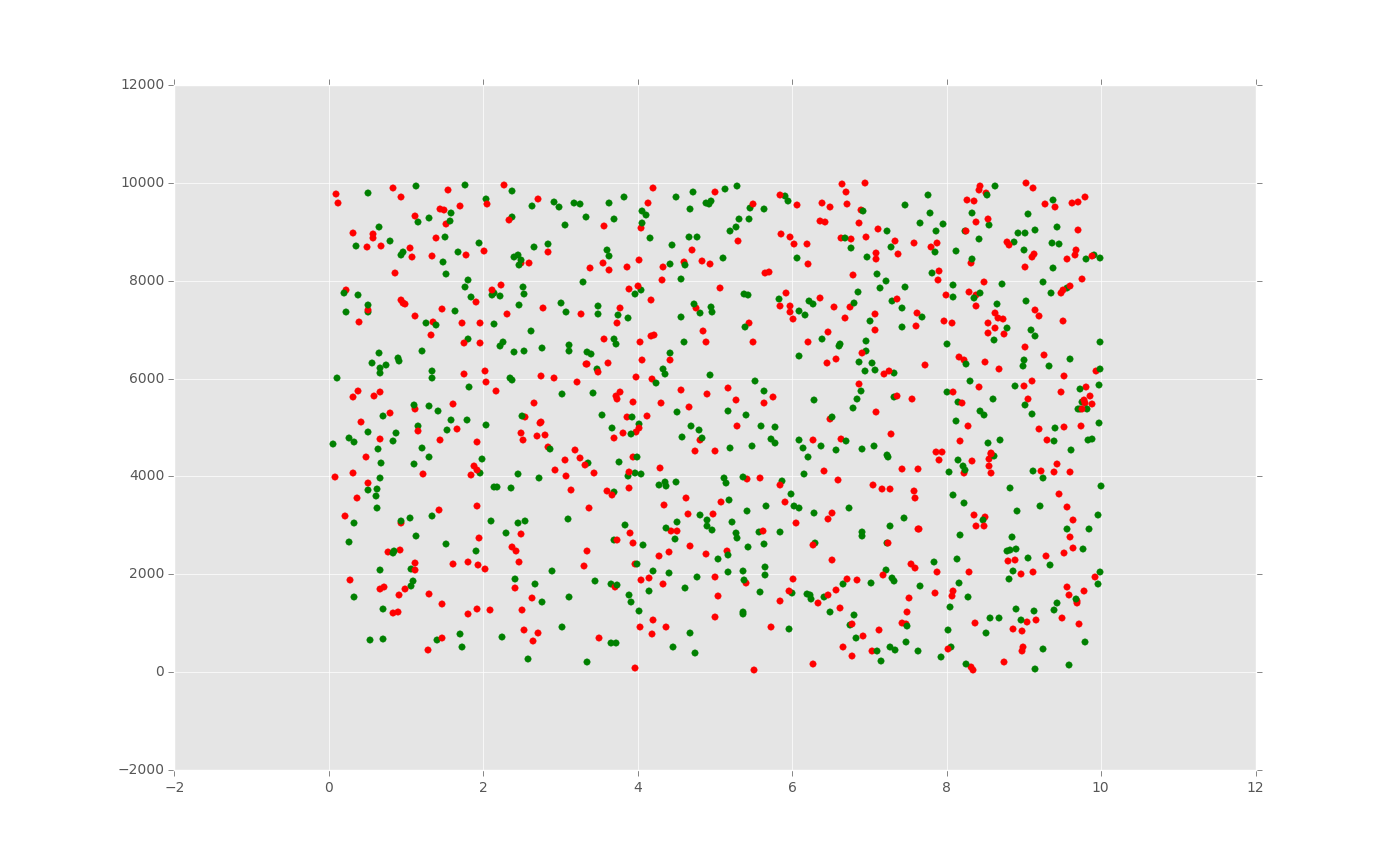
Two dimensional charting monte carlo
import matplotlib
import matplotlib.pyplot as plt
import csv

def graph():
    with open('monteCarloLiberal.csv','r') as montecarlo:
        datas = csv.reader(montecarlo, delimiter=',')
        for eachLine in datas:
            percentROI = float(eachLine[0])
            wagerSizePercent = float(eachLine[1])
            wagerCount = float(eachLine[2])
            pcolor = eachLine[3]

            plt.scatter(wagerSizePercent,wagerCount,color=pcolor)

    plt.show()

graph()
-
Monte Carlo Introduction
-
Monte Carlo dice Function
-
Creating a simple Bettor
-
Plotting Results with Matpltolib
-
Martingale Strategy
-
Bettor Statistics
-
More comparison
-
Graphing Monte Carlo
-
Fixing Debt Issues
-
Analyzing Monte Carlo results
-
Using Monte Carlo to find Best multiple
-
Checking betting results
-
D'Alembert Strategy
-
50/50 Odds
-
Analysis of D'Alembert
-
Comparing Profitability
-
Finding best D'Alembert Multiple
-
Two dimensional charting monte carlo
-
Monte Carlo Simulation and Python
-
Labouchere System for Gambling Tested
