Labouchere System for Gambling Tested
import random
import time
import matplotlib
import matplotlib.pyplot as plt
from matplotlib import style
style.use("ggplot")
broke_count = 0
totalFunded = 0
totalEnding = 0
wins = 0
losses = 0
def Labouchere():
global broke_count
global totalFunded
global totalEnding
global wins
global losses
starting_funds = 100
totalFunded += starting_funds
goal = 10
system = [1,1,1,1,1,1,1,1,1,1]
#system = [1,2,2,3,2]
profit = 0
current_funds = starting_funds
wagerSizes = []
plot_funds = []
not_broke = True
wins = 0
losses = 0
while profit < goal and not_broke:
if len(system) > 1:
size = system[0]+system[-1]
wagerSizes.append(size)
plot_funds.append(current_funds)
else:
size = system[0]
wagerSizes.append(size)
plot_funds.append(current_funds)
if current_funds <= 0:
not_broke = False
broke_count += 1
losses += 1
elif current_funds - size <= 0:
size = current_funds
not_broke = False
broke_count += 1
dice = random.randrange(1,101)
if dice < 51:
losses += 1
system.append(size)
current_funds -= size
profit = current_funds - starting_funds
else:
wins += 1
current_funds += size
profit = current_funds - starting_funds
if profit != goal:
try:
del system[0]
del system[-1]
except:
pass
wagerSizes.append(size)
plot_funds.append(current_funds)
totalEnding += current_funds
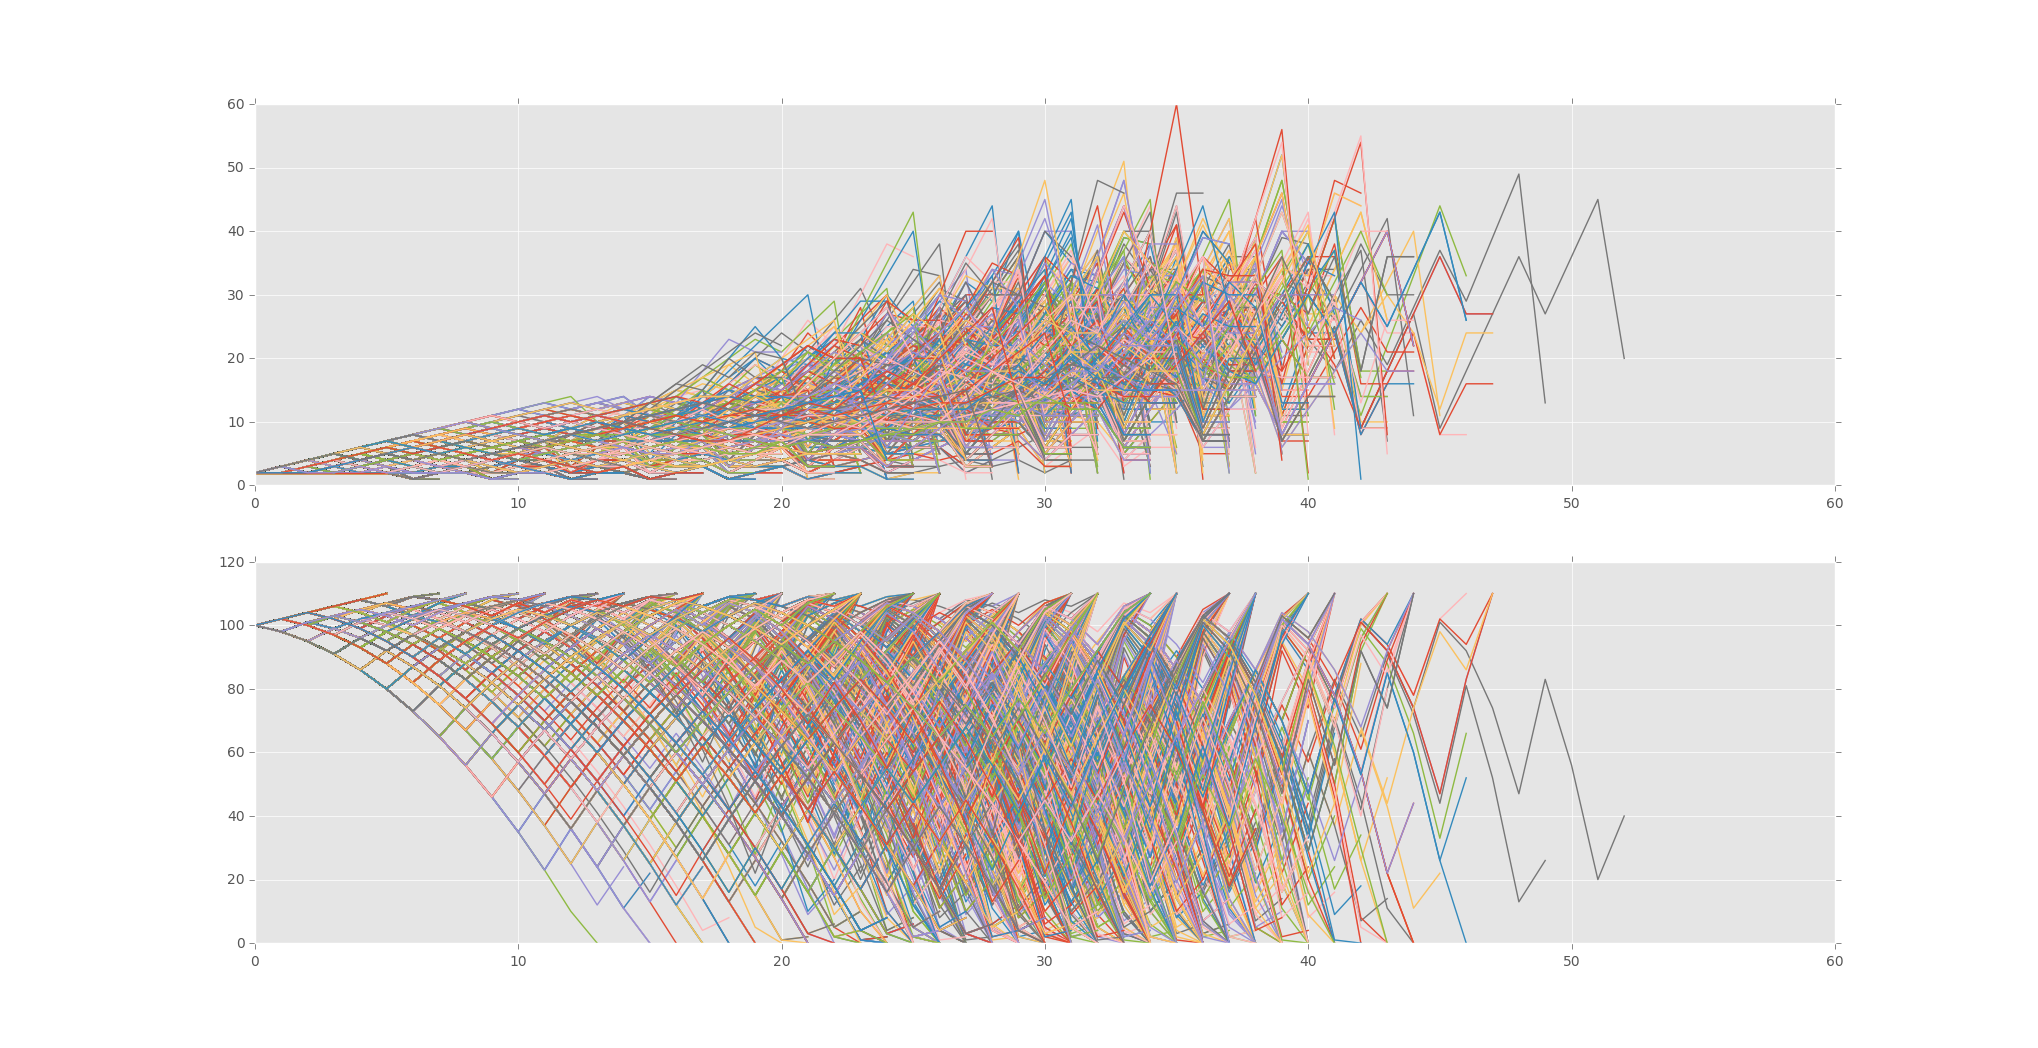
s1.plot(wagerSizes)
s2.plot(plot_funds)
f = plt.figure()
s1 = f.add_subplot(211)
s2 = f.add_subplot(212)
sample_size = 10000
for x in range(sample_size):
Labouchere()
#print("Winners:",wins,"losers:",losses)
print(totalFunded, totalEnding)
print("Broke Percentage:", ((float(broke_count)/sample_size))*100.0)
plt.show()
Outcome:
1000000 1000456
Broke Percentage: 10.41
That's all for this tutorial series. For more Python tutorials, head to the
-
Monte Carlo Introduction
-
Monte Carlo dice Function
-
Creating a simple Bettor
-
Plotting Results with Matpltolib
-
Martingale Strategy
-
Bettor Statistics
-
More comparison
-
Graphing Monte Carlo
-
Fixing Debt Issues
-
Analyzing Monte Carlo results
-
Using Monte Carlo to find Best multiple
-
Checking betting results
-
D'Alembert Strategy
-
50/50 Odds
-
Analysis of D'Alembert
-
Comparing Profitability
-
Finding best D'Alembert Multiple
-
Two dimensional charting monte carlo
-
Monte Carlo Simulation and Python
-
Labouchere System for Gambling Tested
