Data Manipulation
import datetime
import pandas as pd
import pandas.io.data
from pandas import Series, DataFrame
import matplotlib.pyplot as plt
import matplotlib as mpl
import matplotlib.ticker as mticker
import matplotlib.dates as mdates
from matplotlib import style
import numpy as np
style.use('ggplot')
def modifyDataSet():
df = pd.read_csv('X:/stocks_sentdex.csv')
df['time'] = pd.to_datetime(df['time'],unit='s')
df = df.set_index('time')
del df['id']
print df.head()
df.to_csv('X:/stocks_sentdex_dates_full.csv')
def macro():
sp500 = pd.io.data.get_data_yahoo('%5EGSPC',
start=datetime.datetime(2012, 10, 15),
end=datetime.datetime(2014, 5, 11))
ignoreList = ['btcusd','btceur','ltcusd','ltcbtc','btccad','btccny','btcaud','btcjpy','btcgbp']
df = pd.read_csv('X:/stocks_sentdex_dates_full.csv', index_col='time', parse_dates=True)
print df.head()
# we can use this to exclude values, or include specific values.
# you can use this to create indexes, which we will look into later.
for x in ignoreList:
df = df[df.type != x]
counts = df['type'].value_counts()
print counts
_20000MA = pd.rolling_mean(df['value'], 20000)
fixed_20K = _20000MA.copy()
std_1year = pd.rolling_std(_20000MA, 20000, min_periods=20)
ax1 = plt.subplot(2, 1, 1)
sp500['Adj Close'].plot(label='S&P 500')
ax2 = plt.subplot(2, 1, 2, sharex = ax1)
_20000MA.plot(label='20K MA')
plt.legend()
plt.show()
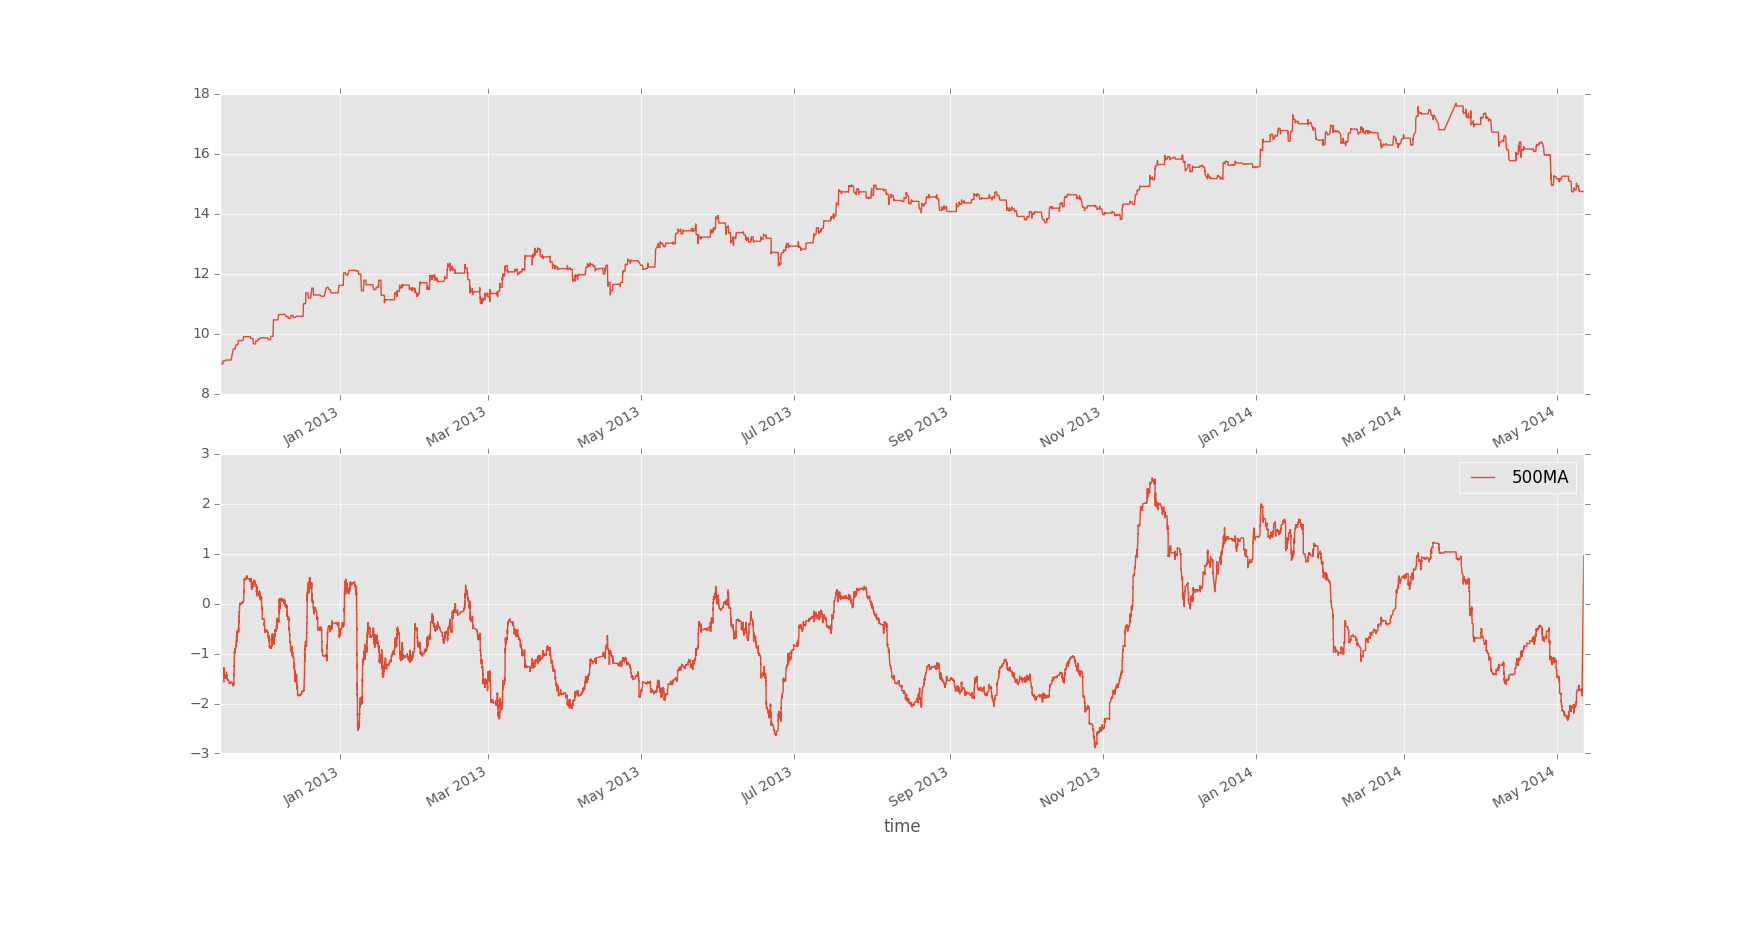
def single_stock(stock_name):
ignoreList = ['btcusd','btceur','ltcusd','ltcbtc','btccad','btccny','btcaud','btcjpy','btcgbp']
df = pd.read_csv('X:/stocks_sentdex_dates_full.csv', index_col='time', parse_dates=True)
print df.head()
for x in ignoreList:
df = df[df.type == stock_name.lower()]
_500MA = pd.rolling_mean(df['value'], 500)
ax1 = plt.subplot(2, 1, 1)
df['close'].plot(label='Price')
ax2 = plt.subplot(2, 1, 2, sharex = ax1)
_500MA.plot(label='500MA')
plt.legend()
plt.show()
single_stock('bac')
The next tutorial:
