Plotting Results with Matpltolib
Monte carlo results from betting
In this video we're going to use matplotlib to further visualize our gamblers and their varying scenarios.
This will be especially useful for when we begin adding different bettor types. So far, we've only been able to see the a single person's various odds examples, nothing more.
Interestingly enough, at this point, should a bettor make their way to doubling their money, they might be thought of as having an expert strategy.
We know this is not true, but the same can be said for stock traders.
Most stock traders are graded on their performance, not by the weight of their risk. We can clearly see already, however, that, statistically, there must be some traders who heavily outperform. Just by sheer odds they must exist, but these people can blow up just as quickly, or usually faster, than they grew. Anyway, let's start up the graphing!
For now, let's actually plot the full path in its entirety. We could simply plot the end result, but that is somewhat boring.
You will need matplotlib for this. You can use pip install for this now by opening cmd.exe or bash and doing:
pip install matplotlib
If you need help with pip, check out the .
import random
import matplotlib
import matplotlib.pyplot as plt

def rollDice():
    roll = random.randint(1,100)

    if roll == 100:
        return False
    elif roll <= 50:
        return False
    elif 100 > roll >= 50:
        return True


'''
Simple bettor, betting the same amount each time.
'''
def simple_bettor(funds,initial_wager,wager_count):
    value = funds
    wager = initial_wager

    # wager X
    wX = []

    #value Y
    vY = []

    # change to 1, to avoid confusion so we start @ wager 1
    # instead of wager 0 and end at 100.
    currentWager = 1

    #           change this to, less or equal.
    while currentWager <= wager_count:
        if rollDice():
            value += wager
            # append #
            wX.append(currentWager)
            vY.append(value)

        else:
            value -= wager
            # append #
            wX.append(currentWager)
            vY.append(value)

        currentWager += 1

    #print 'Funds:', value

    plt.plot(wX,vY)


x = 0

# start this off @ 1, then add, and increase 50 to 500, then 1000
while x < 100:
    simple_bettor(10000,100,1000)
    x += 1


plt.ylabel('Account Value')
plt.xlabel('Wager Count')
plt.show()
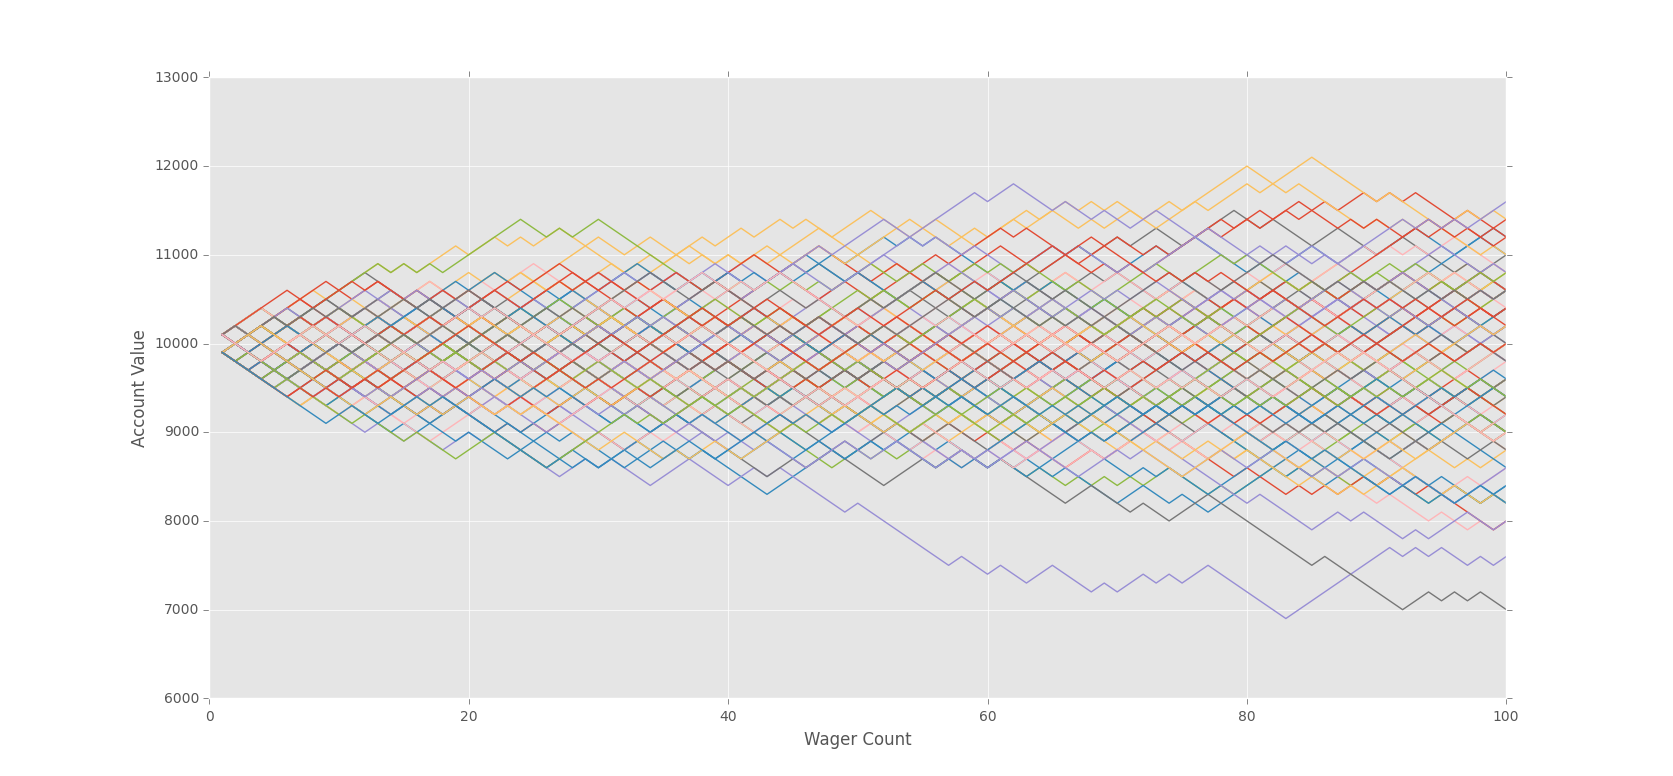
At only 100 bets, it is clear that there is some edge, but it looks like a lot of people are getting lucky. It is only money, let's play!
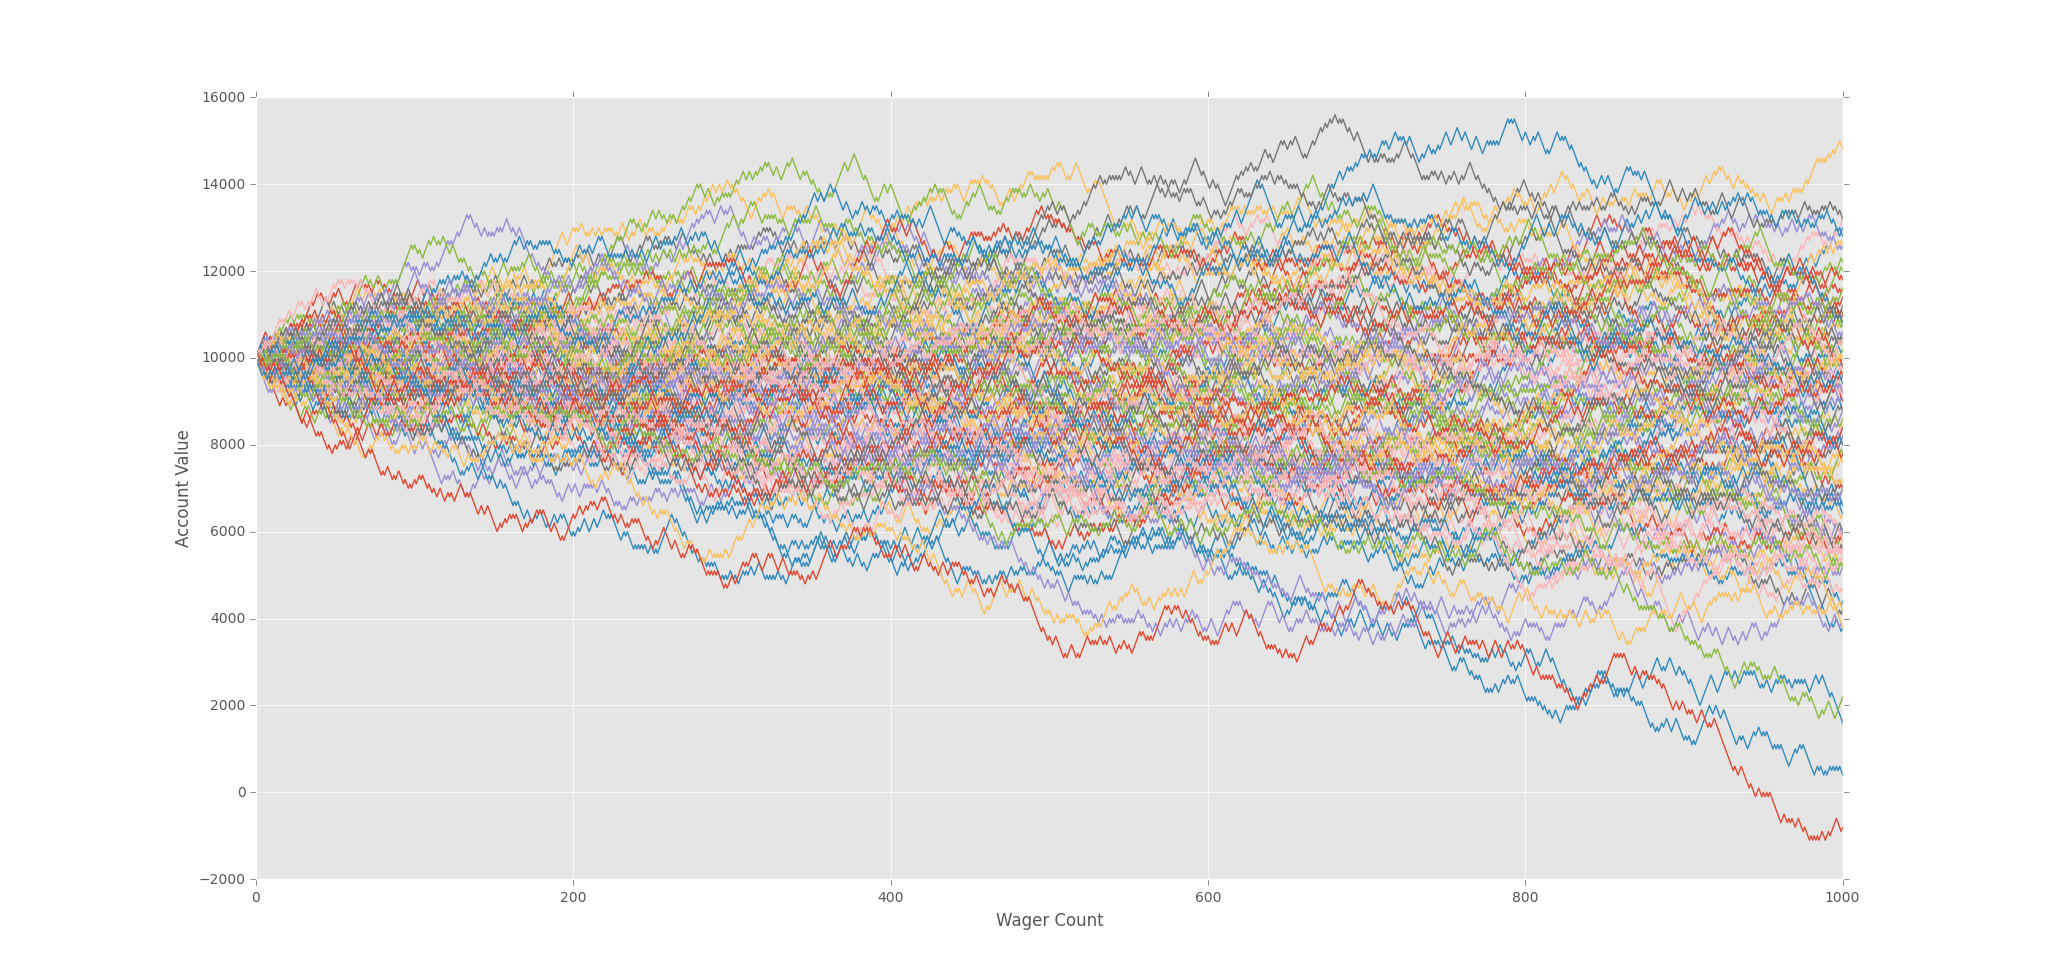
Even at 1,000 bets, some people are making a lot of money!
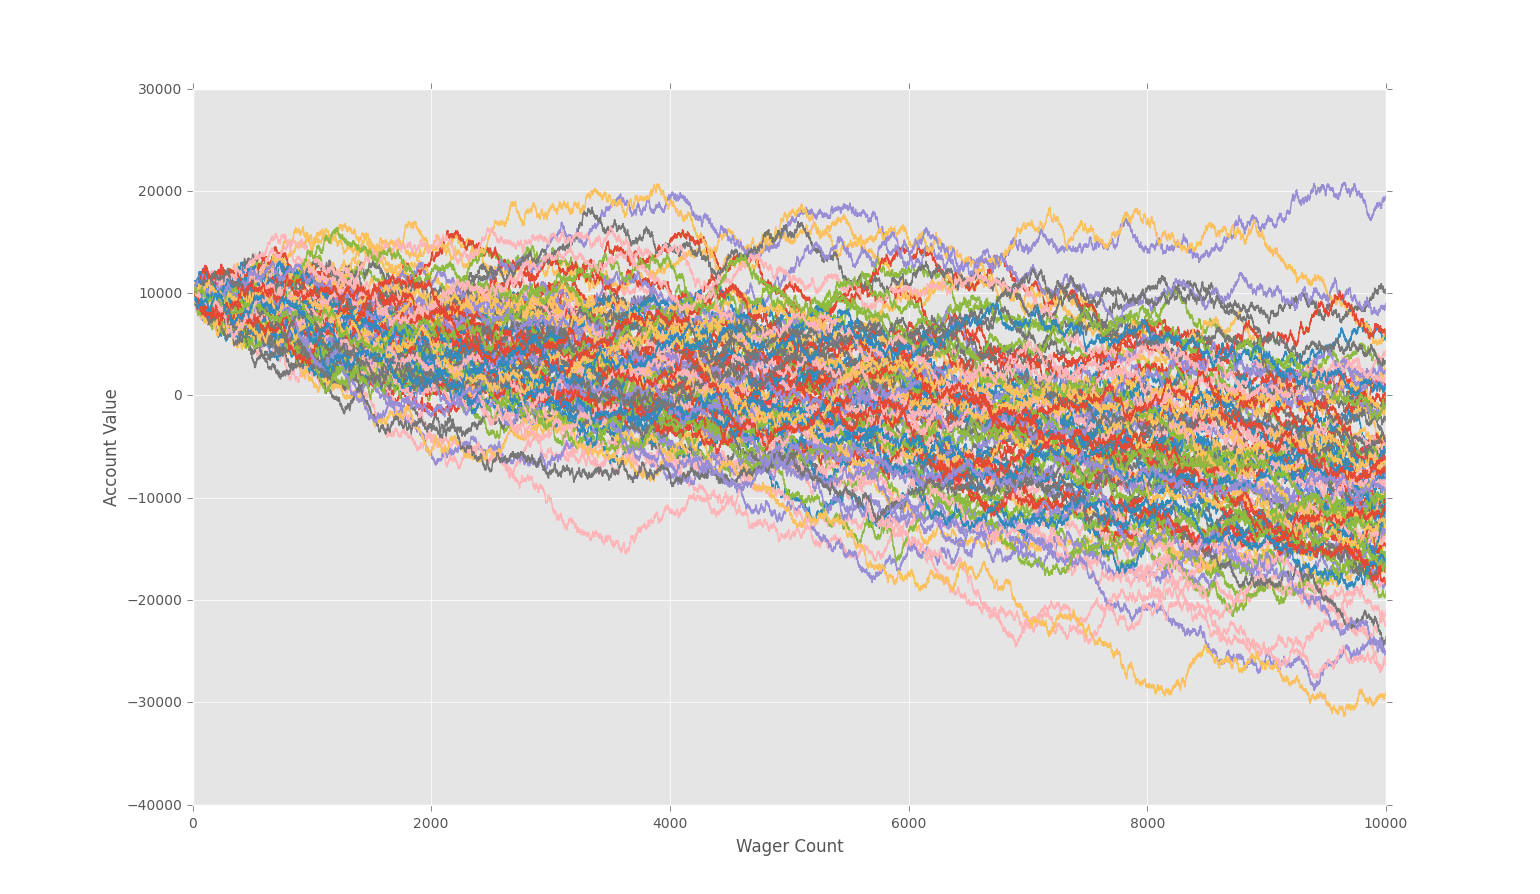
... but at 100,000 it's extremely obvious. In my example, only 2 bettors are in the green. One just barely. A lot of bettors are in heavy debt./p>
This is why gamblers lose. Usually the odds are not extremely heavily stacked against them, just slightly. Casinos just understand basic psychology, knowing that "winning" is extremely addicting. Casinos are built to keep you in, and keep you playing.
In the short term, most players do not really realize that they are so certain to lose, the wins and losses seem pretty even. Some people, almost half, are statistically certain to actually profit. The problem is this is addicting, and they want to continue doing it. They end up continuing, and most end up handing back their gains. It's just simple math, but human psychology is weak.
At this point, bettors, with their bettor mind, begin to envision various strategies to overtake their odds.
One of the most common practices here is doubling up on losses. So, if you lose, you just double your wager until you win. After you've won, you revert back to your starting point. We just need that 1% edge, it should be super easy right?
Let's play that out in the next video.
-
Monte Carlo Introduction
-
Monte Carlo dice Function
-
Creating a simple Bettor
-
Plotting Results with Matpltolib
-
Martingale Strategy
-
Bettor Statistics
-
More comparison
-
Graphing Monte Carlo
-
Fixing Debt Issues
-
Analyzing Monte Carlo results
-
Using Monte Carlo to find Best multiple
-
Checking betting results
-
D'Alembert Strategy
-
50/50 Odds
-
Analysis of D'Alembert
-
Comparing Profitability
-
Finding best D'Alembert Multiple
-
Two dimensional charting monte carlo
-
Monte Carlo Simulation and Python
-
Labouchere System for Gambling Tested
