Interactive User Interface - Data Visualization GUIs with Dash and Python p.2
Welcome to part two of the Dash tutorial series for making interactive data visualization user interfaces with Python. In this tutorial, we're going to cover the user interface interactivity with an example of text input. This example is almost identical to the one you can find in the Dash user-guide. Check it out for more examples of working with Dash.
To begin, let's make some imports:
import dash
from dash.dependencies import Input, Output
import dash_core_components as dcc
import dash_html_components as html

app = dash.Dash()
The new stuff here being the Input and Output imports, which we'll use by wrapping a function that will handle input and output. Dash will use React in the background for us so we can work with these inputs and outputs live.
Our layout will be simple: Have an input field and then an output field. For now, let's just take in the input and repeat it as output.
app.layout = html.Div([
    dcc.Input(id='input', value='Enter something here!', type='text'),
    html.Div(id='output')
])
Next, we'll create the function that outputs whatever we want based on the input. In this case, it'll just be some simple text, but we could also have it output graph data based on some input...etc. We're going to use the following decorator to wrap this function to determine what the inputs and outputs should correspond to:
@app.callback(
    Output(component_id='output', component_property='children'),
    [Input(component_id='input', component_property='value')]
)
If you want to learn more about decorators/wrappers, check out the wrappers tutorial.
To continue, let's build the function:
@app.callback(
    Output(component_id='output', component_property='children'),
    [Input(component_id='input', component_property='value')]
)
def update_value(input_data):
    return 'Input: "{}"'.format(input_data)
Simple for now, but you could imagine ways we could make this more interesting pretty quick. For example, we could be using Quandl, waiting for a valid symbol (assessing validity either by regex or by attempting to pull until something is actually returned) for some dataset, once valid, return the dataframe, maybe in tabular form, or even a graph.
All together now:
import dash
from dash.dependencies import Input, Output
import dash_core_components as dcc
import dash_html_components as html

app = dash.Dash()

app.layout = html.Div([
    dcc.Input(id='input', value='Enter something here!', type='text'),
    html.Div(id='output')
])

@app.callback(
    Output(component_id='output', component_property='children'),
    [Input(component_id='input', component_property='value')]
)
def update_value(input_data):
    return 'Input: "{}"'.format(input_data)


if __name__ == '__main__':
    app.run_server(debug=True)
Running this now gives us:
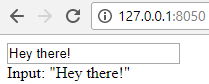
Remember what I said before about using this to dynamically graph something based on a symbol? Let's do just that in the next tutorial.
-
Intro - Data Visualization Applications with Dash and Python p.1
-
Interactive User Interface - Data Visualization GUIs with Dash and Python p.2
-
Dynamic Graph based on User Input - Data Visualization GUIs with Dash and Python p.3
-
Live Graphs - Data Visualization GUIs with Dash and Python p.4
-
Vehicle Data App Example - Data Visualization GUIs with Dash and Python p.5
-
Out of the Box Sentiment Analysis options with Python using VADER Sentiment and TextBlob
-
Streaming Tweets and Sentiment from Twitter in Python - Sentiment Analysis GUI with Dash and Python p.2
-
Reading from our sentiment database - Sentiment Analysis GUI with Dash and Python p.3
-
Live Twitter Sentiment Graph - Sentiment Analysis GUI with Dash and Python p.4
-
Dynamically Graphing Terms for Sentiment - Sentiment Analysis GUI with Dash and Python p.5
-
Deploy Dash App to a VPS web server - Data Visualization Applications with Dash and Python p.11
