Intro - Data Visualization Applications with Dash and Python p.1
Hello and welcome to an updated series on data visualization in Python. It has been a while since I personally have looked into data visualization in Python, being very familiar and comfortable with Matplotlib. Matplotlib is a fine graphing library, and is the backend to many other packages that allow you to graph, such as Pandas' .plot() method. While I have been able to make any graph I have ever wanted in Matplotlib, there are a few issues that I have always experienced:
- Interactivity - Matplotlib graphs can be slightly interacted with, with zooms and such, but any serious interactivity will cost you a lot of time to work in
- Embeddability - While we can embed matplotlib graphs into other applications, this can *often* be a very tedious process, again, taking up a lot of development time.
- Aesthetics - While somewhat trivial, it does matter. When the graphs are just for me, it doesn't matter much what they look like, but, for presentation, it, again, takes a lot of time to make matplotlib visualizations appealing. If you were trying to sell something based on the graphs, or sell an application with embedded charts, Matplotlib is likely unacceptable. I have personally had clients refuse Matplotlib, not based on the ability to represent data, but because the representation wasn't appealing.
For quick graphs to test, prototype...etc, I do still find that I wind up using Matplotlib, mostly because of Pandas' very nice integration.
That said, *much* of the time, I am not actually just trying to make a stand-alone graph. I am trying to make a graphical user interface (GUI) in some form of fashion, and graphs are just a big part. When looking into the other available charting libraries, Bokeh also stands out significantly, which is easily embeddable as well.
Then I came across Dash, from Plot.ly, which helps you to build web-based data visualization interfaces by tying together Plot.ly, React, and Flask.
Let's check it out! I have been using Dash to create a vehicle data monitoring app:
To create something like this within some sort of desktop GUI framework, using something like PyQt or Tkinter, or via some web app like Flask or Django, and then combining it with any of the interactive JS frameworks, and then incorporating the javascript interactivity with jquery, ajax, and React like we are here...would take you quite a bit of time and code. The app shown above, required less than 100 lines of code for the actual GUI/app itself, many of the lines are actually just for styling purposes to keep the code readable.
To use Dash, we need the following packages: dash, dash-renderer, dash-html-components, dash-core-components, and plotly. These packages also have various dependencies. You can install them with:
sudo pip install dash dash-renderer dash-html-components dash-core-components plotly
or, on Windows, open cmd.exe as administrator and do
pip install dash dash-renderer dash-html-components dash-core-components plotly
You may have issues with getting MarkupSafe. If so, you can either remedy the compiler issue by following the steps presented here, or you can just grab a pre-compiled wheel file for markupsafe here: https://www.lfd.uci.edu/~gohlke/pythonlibs/#markupsafe. See the second half of installing packages in Python tutorial for installing .whl packages if you're not sure how to install them.
Let's show a quick and basic example of Dash in action. This will start off as more lines than what might be required to make just a graph in another framework, but, as we convert it to a fully-fleded GUI, it will be vastly simpler than the others.
To begin, let's make some imports:
import dash
import dash_core_components as dcc
import dash_html_components as html
Here, we're just importing things like the dash lib, various components (things like graph components), and then HTML components (things like div tags...etc). Next, we begin our app:
app = dash.Dash()
Since Dash is built around the Flask framework, many of these app settings and setups should look familiar if you are familiar with Flask. Next, we create a layout:
app.layout = html.Div('Dash Tutorials')
In the above case, this would make an app that simply said "Dash Tutorials" on page load. Nothing amazing, but nice and simple! Let's run this:
if __name__ == '__main__':
    app.run_server(debug=True)
Run this, and you should see the following in your console: * Restarting with stat
Now, you can go to your browser, heading to the default 127.0.0.1:8050
You should see something like:
Now, this should be fairly easy to understand right now, but pretty quickly we start adding attributes, and embedding child HTML tags inside of here. For the sake of clarity, the actual content of a tag is contained under a parameter called children, which will look like:
app.layout = html.Div(children='Dash Tutorials')
If you don't have embedded tags, or attributes like style or id or className (the Dash equivalent of HTML's class), then you might not see the need for explicitly naming the children, but I'd suggest you do it for any app that is set to grow.
The children can also be a list of items, not just one. Let's add a graph, that's what we are here for isn't it? To do that, we'll start with a skeleton:
import dash
import dash_core_components as dcc
import dash_html_components as html

app = dash.Dash()

app.layout = html.Div(children=[
    html.H1(children='Dash Tutorials'),
    dcc.Graph()
])

if __name__ == '__main__':
    app.run_server(debug=True)
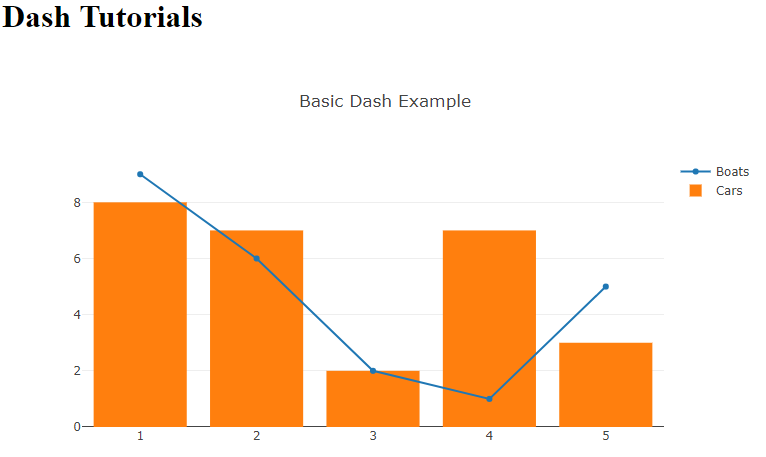
Here, you can see our layout consists of one giant div, which contains the following children: an h1 tag of "dash tutorials" and a dcc.Graph. This wont run yet, we need to specify the elements of the graph, so now let's build that out. Here's a quick graph example:
    dcc.Graph(
        id='example',
        figure={
            'data': [
                {'x': [1, 2, 3, 4, 5], 'y': [9, 6, 2, 1, 5], 'type': 'line', 'name': 'Boats'},
                {'x': [1, 2, 3, 4, 5], 'y': [8, 7, 2, 7, 3], 'type': 'bar', 'name': 'Cars'},
            ],
            'layout': {
                'title': 'Basic Dash Example'
            }
        }
    )
The ID is required, and we can use this later to manipulate the graph. We then have the figure element, which contains the data and layout for the graph. Here is where we pass all of the data and what type of graph we want, along with other bits of information. Inside of layout, we can add thigns like the title we've added here.
Running this now gives us:
I will note that you can change things *live* as your server is running. Every time you save your script, the server should update. Sometimes this doesn't work, or you hit an error, and then things can get funky. When all else fails, you can kill the Python running processes to restart things.
Now that we can see how to create graphs, we are going to focus back on interact-ability. Dash gives us the power of the javascript libary React, which we can use to interact in real time with our app, without needing to reload the page. I will exemplify this in the next tutorial.
-
Intro - Data Visualization Applications with Dash and Python p.1
-
Interactive User Interface - Data Visualization GUIs with Dash and Python p.2
-
Dynamic Graph based on User Input - Data Visualization GUIs with Dash and Python p.3
-
Live Graphs - Data Visualization GUIs with Dash and Python p.4
-
Vehicle Data App Example - Data Visualization GUIs with Dash and Python p.5
-
Out of the Box Sentiment Analysis options with Python using VADER Sentiment and TextBlob
-
Streaming Tweets and Sentiment from Twitter in Python - Sentiment Analysis GUI with Dash and Python p.2
-
Reading from our sentiment database - Sentiment Analysis GUI with Dash and Python p.3
-
Live Twitter Sentiment Graph - Sentiment Analysis GUI with Dash and Python p.4
-
Dynamically Graphing Terms for Sentiment - Sentiment Analysis GUI with Dash and Python p.5
-
Deploy Dash App to a VPS web server - Data Visualization Applications with Dash and Python p.11
