Graphing Monte Carlo
Alright, so we've got our two bettors, we've seen survival rate, but there is more to it than survival rate. Of the survivors, who is the winner, also, is there a point at which a bettor should stop as their odds significantly decrease after a certain point?
Take our doubler bettor for example. Should this doubler bettor actually reach 10x his initial investment, how wise is it that he continues? We are certain that, on a long enough timeline, this doubler will lose everything, so at what point might we be content at our lottery winnings?
Many questions, but first, let's just compare our bettors!
Since we will be comparing bettors, and eventually maybe have a handful, it would be wise to just set the starting funds, wager size, and wager count ahead of time globally.
import random
import matplotlib
import matplotlib.pyplot as plt
import time


sampleSize = 100

startingFunds = 10000
wagerSize = 100
wagerCount = 1000


def rollDice():
    roll = random.randint(1,100)

    if roll == 100:
        return False
    elif roll <= 50:
        return False
    elif 100 > roll >= 50:
        return True


def doubler_bettor(funds,initial_wager,wager_count):

    value = funds
    wager = initial_wager
    wX = []
    vY = []
    currentWager = 1
    previousWager = 'win'
    previousWagerAmount = initial_wager

    while currentWager <= wager_count:
        if previousWager == 'win':
            if rollDice():
                value += wager
                wX.append(currentWager)
                vY.append(value)
            else:
                value -= wager
                previousWager = 'loss'
                previousWagerAmount = wager
                wX.append(currentWager)
                vY.append(value)
                if value < 0:
                    currentWager += 10000000000000000
        elif previousWager == 'loss':
            if rollDice():
                wager = previousWagerAmount * 2
                value += wager
                wager = initial_wager
                previousWager = 'win'
                wX.append(currentWager)
                vY.append(value)
            else:
                wager = previousWagerAmount * 2
                value -= wager
                previousWager = 'loss'
                previousWagerAmount = wager
                wX.append(currentWager)
                vY.append(value)
                if value < 0:
                    currentWager += 10000000000000000

        currentWager += 1
    # this guy goes cyan #
    plt.plot(wX,vY,'c')

#####                                           color#
def simple_bettor(funds,initial_wager,wager_count,color):
    ####

    value = funds
    wager = initial_wager
    wX = []
    vY = []
    currentWager = 1
    while currentWager <= wager_count:
        if rollDice():
            value += wager
            wX.append(currentWager)
            vY.append(value)
        else:
            value -= wager
            wX.append(currentWager)
            vY.append(value)

            ###add me
            if value < 0:
                currentWager += 10000000000000000
        currentWager += 1

    # this guy goes green #
    plt.plot(wX,vY,color)


x = 0

while x < sampleSize:
    simple_bettor(startingFunds,wagerSize,wagerCount,'k')
    simple_bettor(startingFunds,wagerSize*2,wagerCount,'c')
    #doubler_bettor(startingFunds,wagerSize,wagerCount)
    x+=1

plt.axhline(0, color = 'r')
plt.ylabel('Account Value')
plt.xlabel('Wager Count')
plt.show()
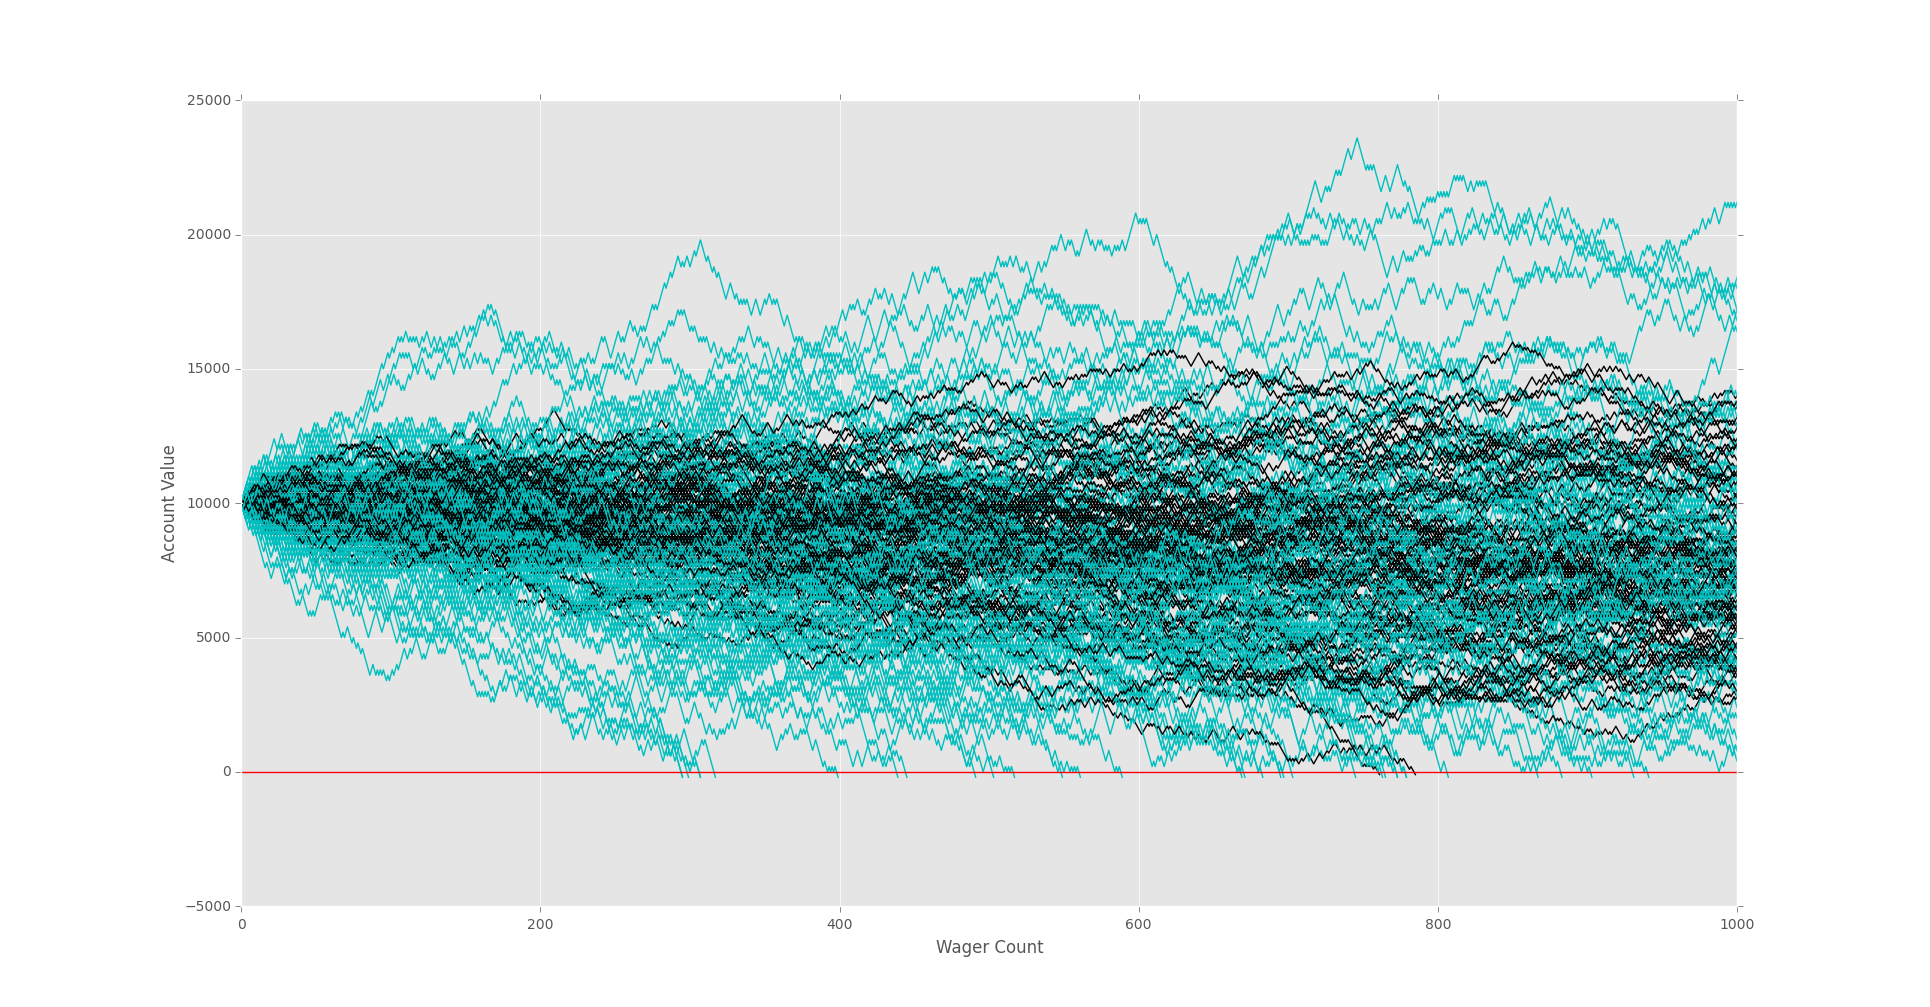
Initially, with 1,000 wagers, it looks fairly comparable.
Let's look at 10,000 wagers next:
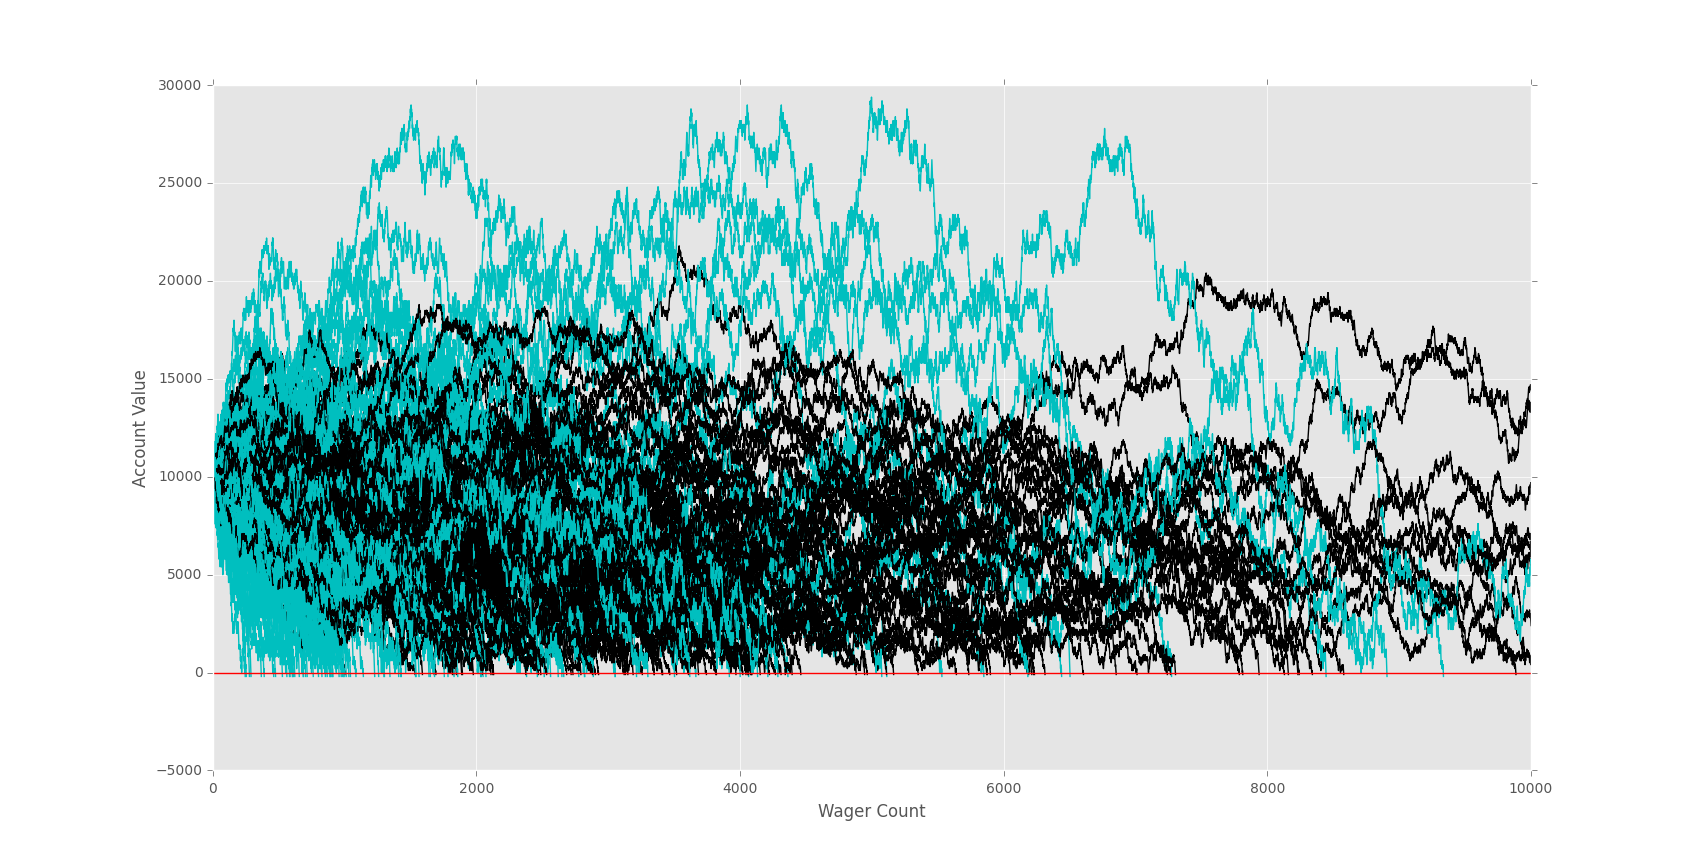
On a longer term, our doubler better is clearly dying out. Is it because it is an inferior strategy? Not really. The doubler bettor is just a doubler, and they are increasing the pace by doubling their bets. Thus, they are speeding up the process. That's really all doubling will do for you.
-
Monte Carlo Introduction
-
Monte Carlo dice Function
-
Creating a simple Bettor
-
Plotting Results with Matpltolib
-
Martingale Strategy
-
Bettor Statistics
-
More comparison
-
Graphing Monte Carlo
-
Fixing Debt Issues
-
Analyzing Monte Carlo results
-
Using Monte Carlo to find Best multiple
-
Checking betting results
-
D'Alembert Strategy
-
50/50 Odds
-
Analysis of D'Alembert
-
Comparing Profitability
-
Finding best D'Alembert Multiple
-
Two dimensional charting monte carlo
-
Monte Carlo Simulation and Python
-
Labouchere System for Gambling Tested
