Analyzing Monte Carlo results
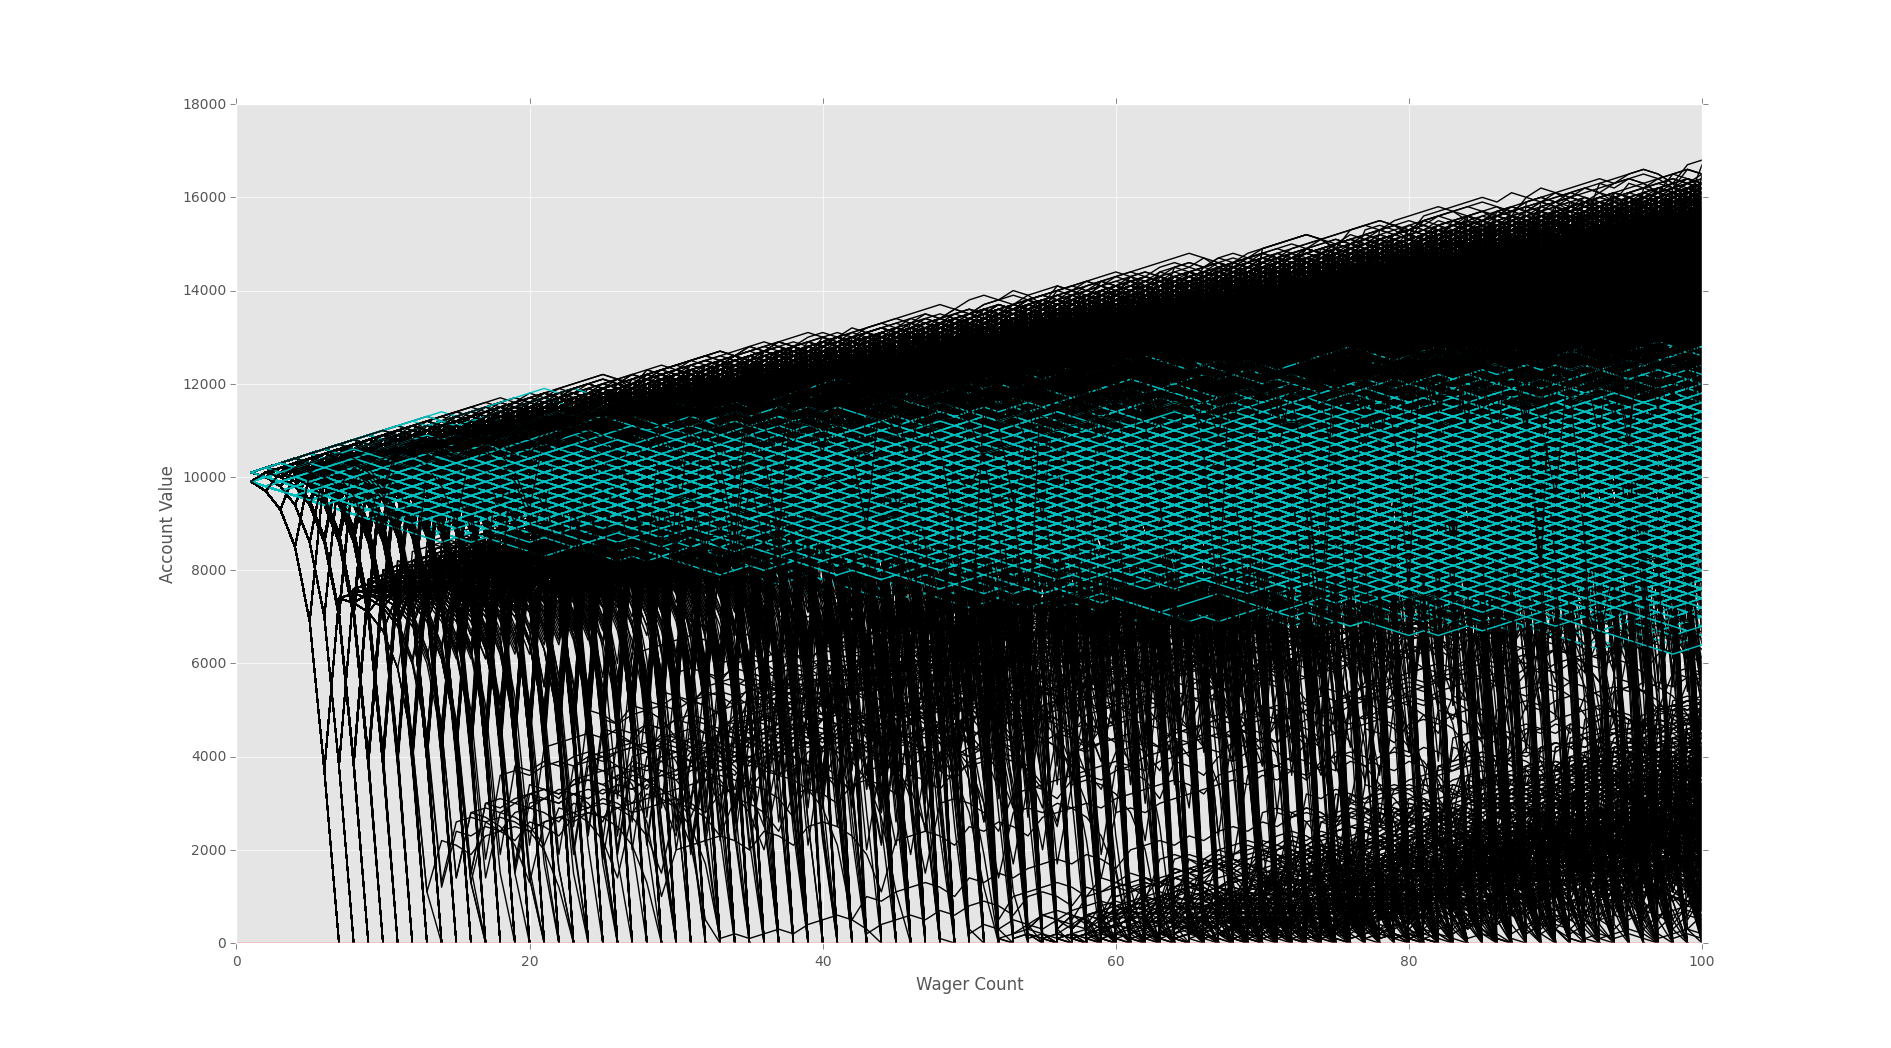
So now that we've compared the life expectency of these strategies, we should also compare profits. First we can just compare profit vs loss, but also degree of profits is important. Both strategies stand to lose equal amounts, but this is not the case for gains. It is clear that our doublor bettor, despite having lower life expectancy, has far more upside compared to the simple bettor.
import random
import matplotlib
import matplotlib.pyplot as plt
import time

sampleSize = 10000
startingFunds = 10000
wagerSize = 100
wagerCount = 100


def rollDice():
    roll = random.randint(1,100)

    if roll == 100:
        return False
    elif roll <= 50:
        return False
    elif 100 > roll >= 50:
        return True

def doubler_bettor(funds,initial_wager,wager_count,color):
    global doubler_busts
    #####################
    global doubler_profits
    value = funds
    wager = initial_wager
    wX = []
    vY = []
    currentWager = 1
    previousWager = 'win'
    previousWagerAmount = initial_wager

    while currentWager <= wager_count:
        if previousWager == 'win':
            if rollDice():
                value += wager
                wX.append(currentWager)
                vY.append(value)
            else:
                value -= wager
                previousWager = 'loss'
                previousWagerAmount = wager
                wX.append(currentWager)
                vY.append(value)
                if value < 0:
                    currentWager += 10000000000000000
                    doubler_busts += 1
        elif previousWager == 'loss':
            if rollDice():
                wager = previousWagerAmount * 2
                if (value - wager) < 0:
                    wager = value

                value += wager
                wager = initial_wager
                previousWager = 'win'
                wX.append(currentWager)
                vY.append(value)
            else:
                wager = previousWagerAmount * 2
                if (value - wager) < 0:
                    wager = value
                value -= wager
                previousWager = 'loss'
                previousWagerAmount = wager
                wX.append(currentWager)
                vY.append(value)

                if value <= 0:
                    currentWager += 10000000000000000
                    doubler_busts += 1

        currentWager += 1
    plt.plot(wX,vY,color)
    #####################
    if value > funds:
        doubler_profits+=1


'''
Simple bettor, betting the same amount each time.
'''

def simple_bettor(funds,initial_wager,wager_count,color):
    global simple_busts
    #####################
    global simple_profits

    value = funds
    wager = initial_wager
    wX = []
    vY = []
    currentWager = 1
    while currentWager <= wager_count:
        if rollDice():
            value += wager
            wX.append(currentWager)
            vY.append(value)
        else:
            value -= wager
            wX.append(currentWager)
            vY.append(value)

            if value <= 0:
                currentWager += 10000000000000000
                simple_busts +=1
        currentWager += 1
    plt.plot(wX,vY,color)
    #####################
    if value > funds:
        simple_profits+=1


x = 0


simple_busts = 0.0
doubler_busts = 0.0

#####################
simple_profits = 0.0
doubler_profits = 0.0


while x < sampleSize:
    simple_bettor(startingFunds,wagerSize,wagerCount,'c')
    #simple_bettor(startingFunds,wagerSize*2,wagerCount,'c')
    doubler_bettor(startingFunds,wagerSize,wagerCount,'k')
    x+=1


print(('Simple Bettor Bust Chances:', (simple_busts/sampleSize)*100.00))
print(('Doubler Bettor Bust Chances:', (doubler_busts/sampleSize)*100.00))

print (('Simple Bettor Profit Chances:', (simple_profits/sampleSize)*100.00))
print(('Doubler Bettor Profit Chances:', (doubler_profits/sampleSize)*100.00))


plt.axhline(0, color = 'r')
plt.ylabel('Account Value')
plt.xlabel('Wager Count')
plt.show()
Your results may vary slightly, but they should be something like:
('Simple Bettor Bust Chances:', 0.0)
('Doubler Bettor Bust Chances:', 31.269999999999996)
('Simple Bettor Profit Chances:', 38.32)
('Doubler Bettor Profit Chances:', 63.190000000000005)
-
Monte Carlo Introduction
-
Monte Carlo dice Function
-
Creating a simple Bettor
-
Plotting Results with Matpltolib
-
Martingale Strategy
-
Bettor Statistics
-
More comparison
-
Graphing Monte Carlo
-
Fixing Debt Issues
-
Analyzing Monte Carlo results
-
Using Monte Carlo to find Best multiple
-
Checking betting results
-
D'Alembert Strategy
-
50/50 Odds
-
Analysis of D'Alembert
-
Comparing Profitability
-
Finding best D'Alembert Multiple
-
Two dimensional charting monte carlo
-
Monte Carlo Simulation and Python
-
Labouchere System for Gambling Tested
