Quick Look at our Data
Hello and welcome to part 2 of machine learning and pattern recognition for use with stocks and Forex trading.
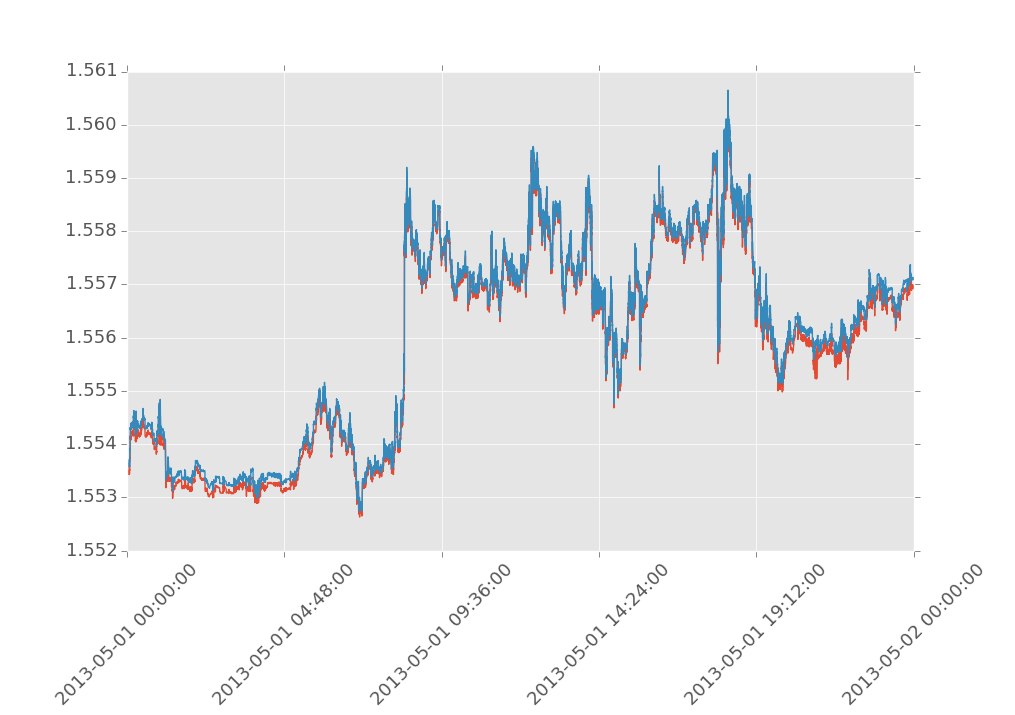
The first thing we need to do is go ahead and plot this data out to see what we're working with, and see what our goals are.
It's a good idea to get comfortable with visualizing data in Python.
import matplotlib
import matplotlib.pyplot as plt
import matplotlib.ticker as mticker
import matplotlib.dates as mdates
import numpy as np
from matplotlib import style
style.use("ggplot")


def graphRawFX():
    date,bid,ask = np.loadtxt('GBPUSD1d.txt', unpack=True,
                              delimiter=',',
                              converters={0:mdates.strpdate2num('%Y%m%d%H%M%S')})

    fig=plt.figure(figsize=(10,7))

    ax1 = plt.subplot2grid((40,40), (0,0), rowspan=40, colspan=40)
    ax1.plot(date,bid)
    ax1.plot(date,ask)

    ax1.xaxis.set_major_formatter(mdates.DateFormatter('%Y-%m-%d %H:%M:%S'))

    for label in ax1.xaxis.get_ticklabels():
            label.set_rotation(45)
    plt.subplots_adjust(bottom=.23)
    plt.gca().get_yaxis().get_major_formatter().set_useOffset(False)
    plt.grid(True)
    plt.show()
-
Introduction
-
Quick Look at our Data
-
Basics
-
Percent Change
-
Finding Patterns
-
Storing Patterns
-
Current Pattern
-
Predicting outcomes
-
More predicting
-
Increasing pattern complexity
-
More on Patterns
-
Displaying all patterns
-
Variables in patterns
-
Past outcomes as possible predictions
-
Predicting from patterns
-
Average outcomes as predictions
