Machine Learning and Pattern Recognition for Algorithmic Forex and Stock Trading
Introduction
Machine learning in any form, including pattern recognition, has of course many uses from voice and facial recognition to medical research. In this case, our question is whether or not we can use pattern recognition to reference previous situations that were similar in pattern. If we can do that, can we then make trades based on what we know happened with those patterns in the past and actually make a profit?
To do this, we're going to completely code everything ourselves. If you happen to enjoy this topic, the next step would be to look into GPU acceleration or threading. We're only going to need Matplotlib (for data visualization) and some NumPy (for number crunching), and the rest is up to us.
Python is naturally a single-threaded language, meaning each script will only use a single cpu (usually this means it uses a single cpu core, and sometimes even just half or a quarter, or worse, of that core).
This is why programs in Python may take a while to computer something, yet your processing might only be 5% and RAM 10%.
To learn more about threading, you can view the threading tutorial on this site.
The easiest way to get these modules nowadays is to use pip install.
Don't know what pip is or how to install modules?Pip is probably the easiest way to install packages Once you install Python, you should be able to open your command prompt, like cmd.exe on windows, or bash on linux, and type:
pip install numpypip install matplotlib
Having trouble still? No problem, there's a tutorial for that: pip install Python modules tutorial.
If you're still having trouble, feel free to contact us, using the contact in the footer of this website.
The plan is to take a group of prices in a time frame, and convert them to percent change in an effort to normalize the data. Let's say we take 50 consecutive price points for the sake of explanation. What we'll do is map this pattern into memory, move forward one price point, and re-map the pattern. For each pattern that we map into memory, we then want to leap forward a bit, say, 10 price points, and log where the price is at that point. We then map this "outcome" to the pattern and continue. Every pattern has its result.
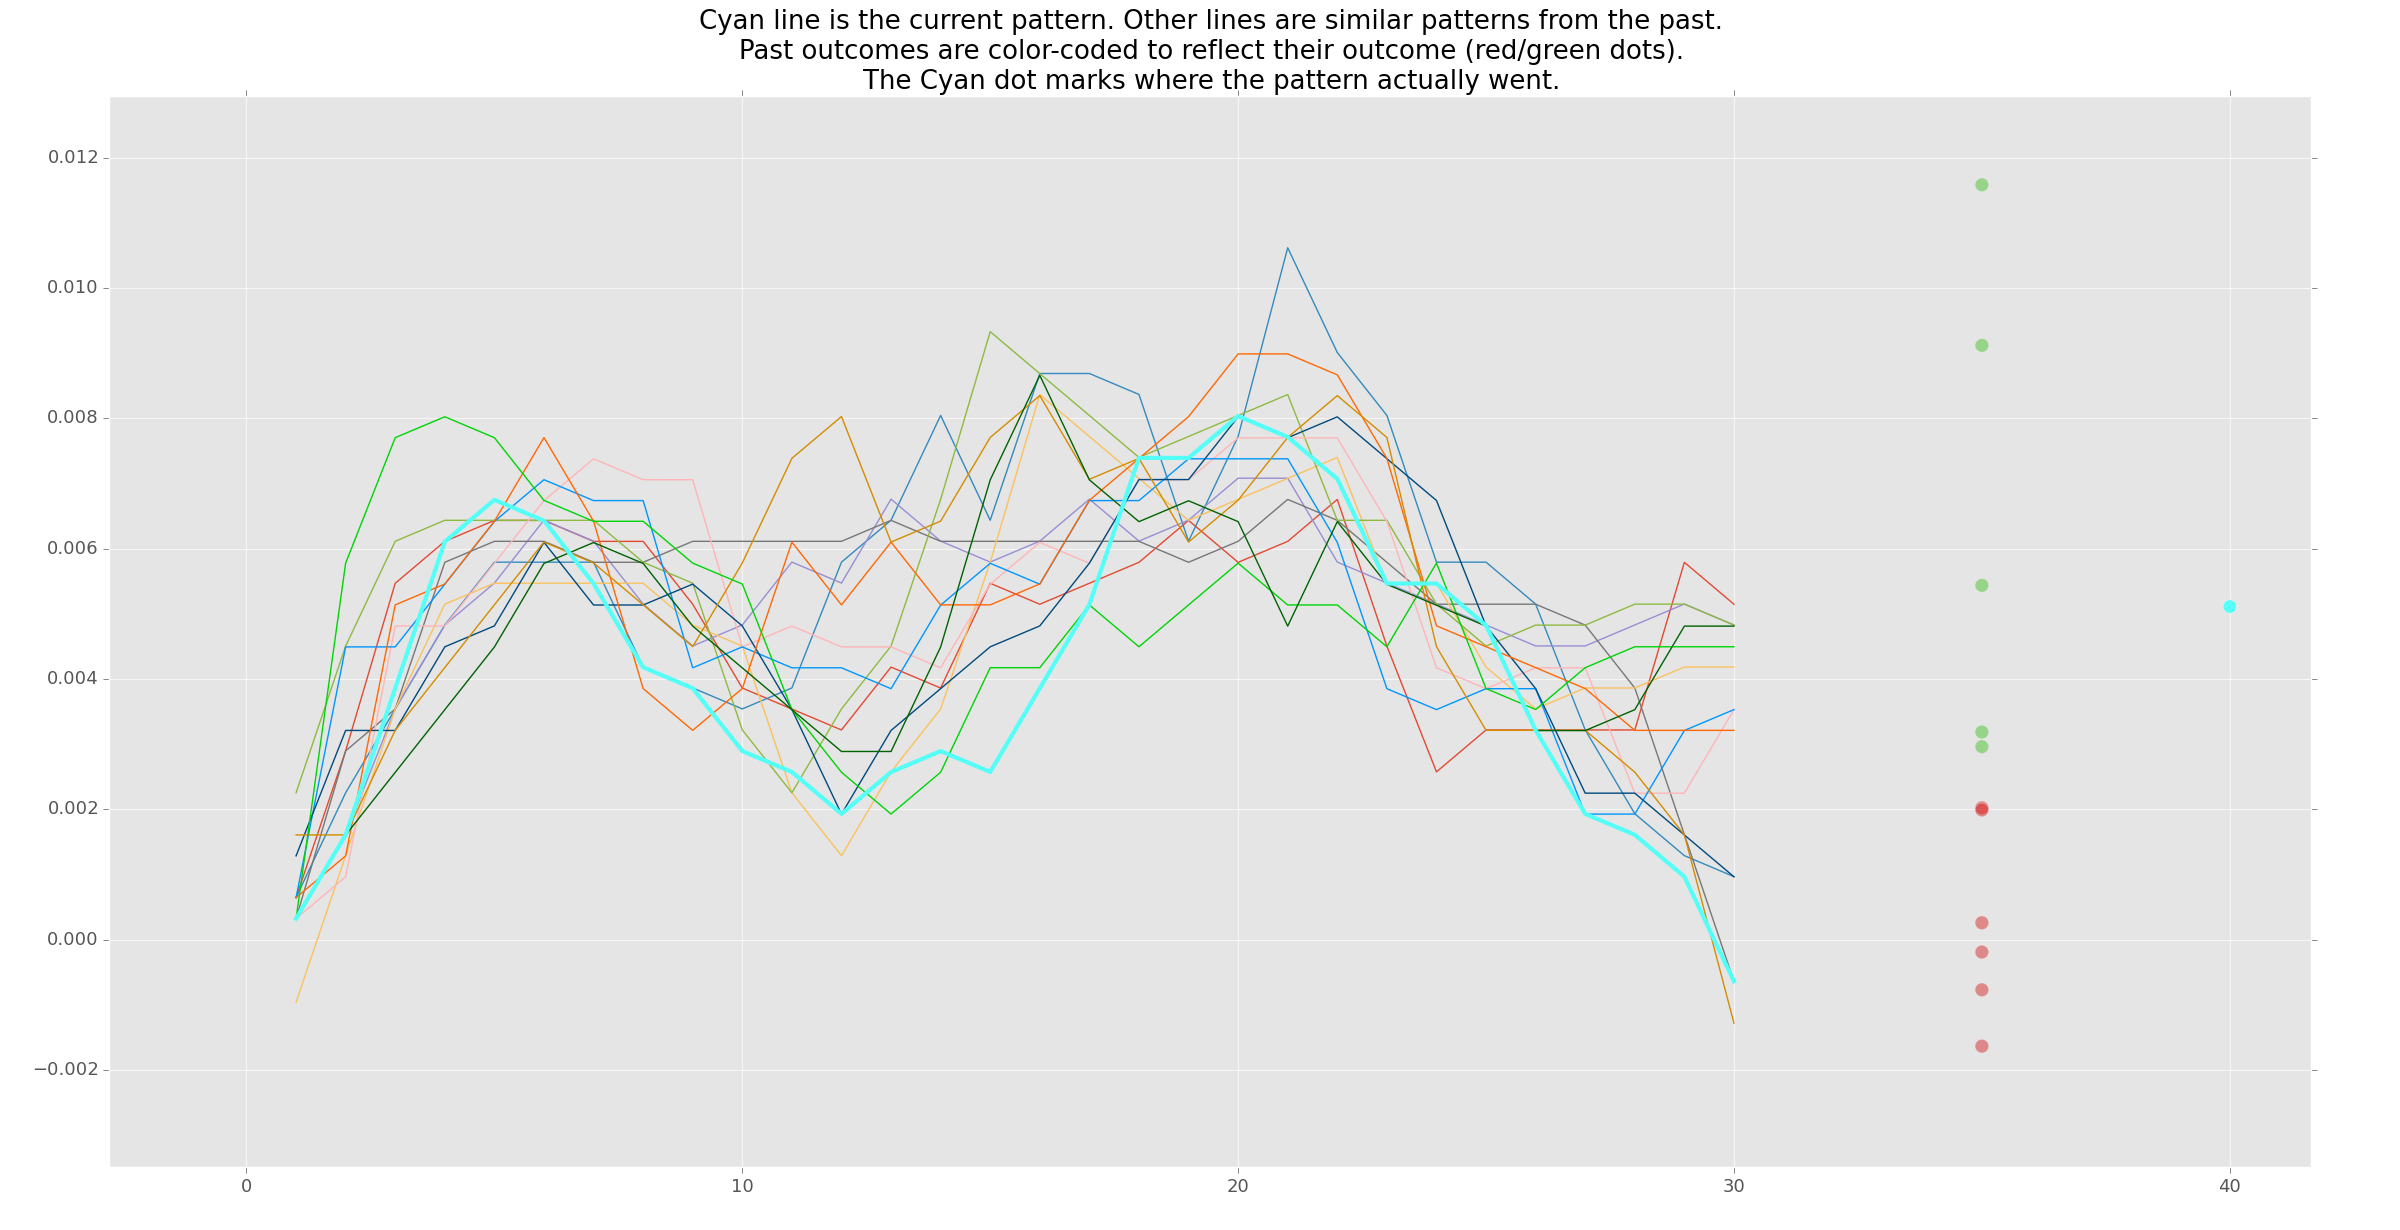
Next, we take the current pattern, and compare it to all previous patterns. What we'll do is compare the percent similarity to all previous patterns. If their percent similarity is more than a certain threshold, then we're going to consider it. From here, maybe we have 20-30 comparable patterns from history. With these similar patterns, we can then aggregate all of their outcomes, and come up with an estimated "average" outcome. With that average outcome, if it is very favorable, then we might initiate a buy. If the outcome is not favorable, maybe we sell, or short.
For visualization, here's an example:
In the above example, the predicted average pattern is to go up, so we might initiate a buy.
This series will not end with you having any sort of get-rich-quick algorithm. There are a few known bugs with this program, and the chances of you being able to execute trades fast enough with this tick data is unlikely, unless you are a bank. The goal here is to show you just how easy and basic pattern recognition is. As long as you have some basic Python programming knowledge, you should be able to follow along.
-
Introduction
-
Quick Look at our Data
-
Basics
-
Percent Change
-
Finding Patterns
-
Storing Patterns
-
Current Pattern
-
Predicting outcomes
-
More predicting
-
Increasing pattern complexity
-
More on Patterns
-
Displaying all patterns
-
Variables in patterns
-
Past outcomes as possible predictions
-
Predicting from patterns
-
Average outcomes as predictions
