Pandas 2D Visualization of Pandas data with Matplotlib, including plotting dates
One of the most powerful aspects of Pandas is it's easy inclusion into the Matplotlib module. Matplotlib is a popular and robust Python module that allows programmers to create graphs and charts from their data. Pandas makes loading your data into Matplotlib slightly easier, as well as handles almost all of the processing necessary to get it ready for Matplotlib. Pandas is basically created to do this in the most efficient way possible. Pandas is also quite remarkably good at working with data with dates and Matplotlib. Traditionally, working with data that is indexed by date is somewhat challenging with Matplotlib, but not when using Pandas!
import pandas as pd
from pandas import DataFrame
import matplotlib.pyplot as plt

df = pd.read_csv('sp500_ohlc.csv', index_col = 'Date', parse_dates=True)
df['H-L'] = df.High - df.Low
df['100MA'] = pd.rolling_mean(df['Close'], 100)
All typical code up to this point, then we call to plot:
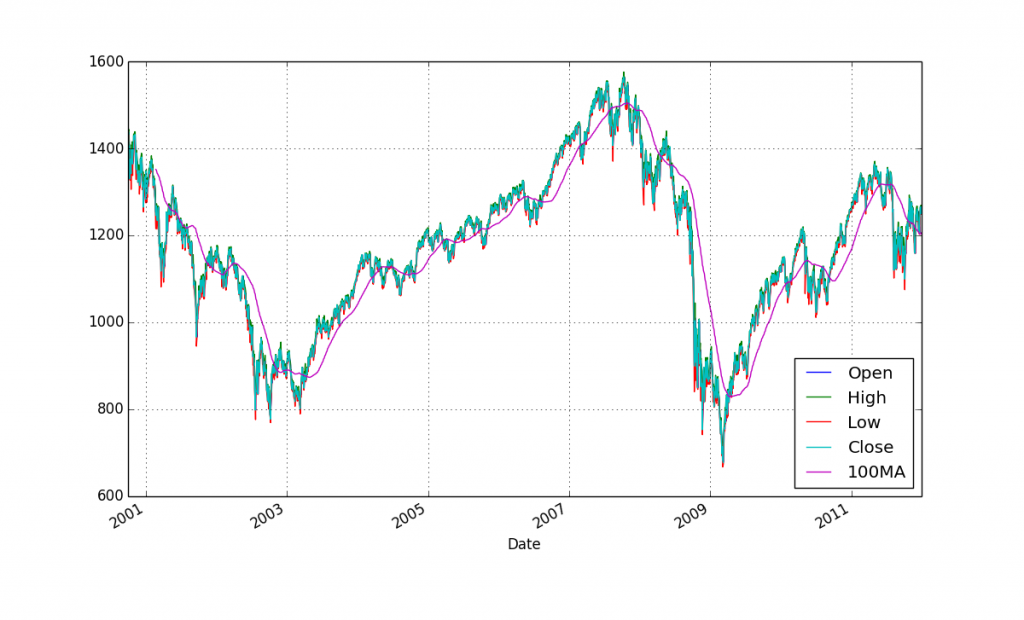
df[['Open','High','Low','Close','100MA']].plot()
plt.show()
The above will generate the Matplotlib code and create a lovely chart! If you data is "normalized" enough to all fit on 1 figure, you could also do df.plot(). The reason why we cannot do this here is because we have columns like H-L and, more especially, volume. Since volume is quite drastically different. Even though we could have done it very simply with df.plot(), this also gave me the chance to show you that you can also plot very specific things as well if you like. What's exceedingly great about this is that you don't have to mess at all with the x axis and dates! I also quite like the automatic legend moving around to avoid going over the lines.
Now, what if you have been through my matplotlib series where you learned all sorts of crazy things that you can do with graphing, and you cannot figure it out with Pandas? You can still plot objects through Matplotlib as well. Pandas offers an "almost" custom version of Matplotlib, where it basically handles the entire transaction, but you are free to revert back to the normal instance of Matplotlib and code everything yourself.
-
Intro to Pandas and Saving to a CSV and reading from a CSV
-
Pandas Column manipulation
-
Pandas Column Operations (basic math operations and moving averages)
-
Pandas 2D Visualization of Pandas data with Matplotlib, including plotting dates
-
Pandas 3D Visualization of Pandas data with Matplotlib
-
Pandas Standard Deviation
-
Pandas Correlation matrix and Statistics Information on Data
-
Pandas Function mapping for advanced Pandas users
